MCQ
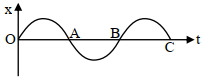
Among the four graph shown in the figure there is only one graph for which average velocity over the time interval $(0, T)$ can vanish for a suitably chosen $T$. Which one is it?
- ✓

- B

- C

- D

In graph $(b)$ for one value of displacement there are two different points of time. Hence, for one time, the average velocity is positive and for other time is equivalent negative.As there are opposite velocities in the interval $0$ to $T$, hence average velocity can vanish in $(b)$.This can be seen in the figure given Here, $O A=B T$ (same displacement) for two different points of time.
Generate a complete, print-ready paper with questions like this in minutes — across 16+ boards, with answer keys.