Question 14 Marks
Write a python program to plot the grouped bar chart for the given data:
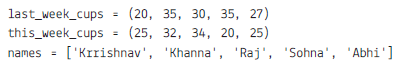
The program is to be implemented to sub plot
4 questions · timed · auto-graded
The program is to be implemented to sub plot
![]()
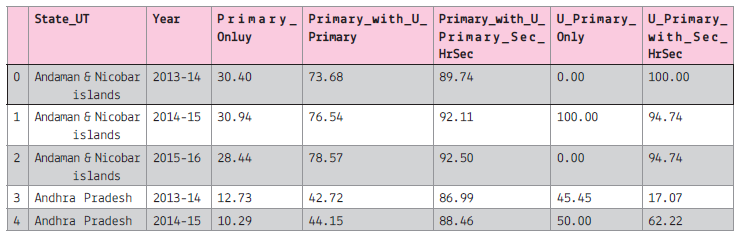
data name : Percentage of Schools with Computers from 2013-14 to 2015-16
Screen shot of the data:
Assuming that we have saved the file with name: "computer_data" in python default folder.
Assuming that all the required libraries are imported once:
![]()
(i) To create the data frame of the above file.
(ii) To display all the column names of the data frame.
(iii) To plot the line graph for the first 5 record of the Primary Only column on y-axis and 'State_UT' on x-axis.
The line colour should be red and marker as 'x'. The graph will display only 2013-14
(iv) To display the histogram of the 2013-14, primary_only column.
(v) To display bar graph of the last 7 record of the year 2013-14 use the title and required label. Also write the statement to create the data frame.
(vi) To display the pie chart of the first 10 records of the 2013-14. Also create the data frame.
(vii) To display the boxplot for the Sec with higher secondary and All India data.
(viii) To display the scatter diagram of the 2014-15
https://data.gov.in/catalog/statistical-hand-book-2009-education?filters%5Bfield_catalog_reference%5D=6690578& format=json&offset=6&limit=6&sort%5Bcreated%5D=desc
Schools for Professional Education 2007-08 : SHB 2009
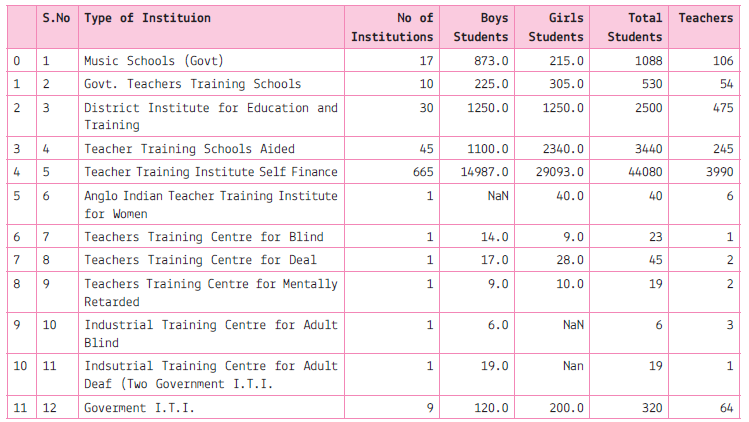
(i) Write a python / statement to read the data frame.
(ii) Write a python code to plot the pie chart of all the institutions which have more than hundred teachers. Also display the values of portion.
(iii) Write a python code to plot the horizontal bar chart to plot the Type of institution and Total students.
(iv) Write a python code to plot the scatter diagram boys vs girls students.
(v) Write a python code to plot the histogram for no. of institution.