Question
Attempt this question on graph paper. Marks obtained by $200$ students in examination are given below:
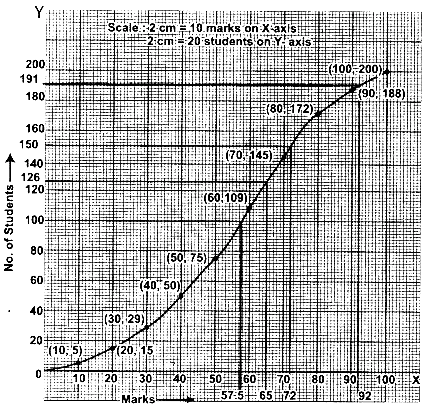
Draw an ogive for the given distribution taking $2$ cm $= 10$ makrs on one axis and $2\ cm = 20$ students on the other axis.
From the graph find:
(i) the median
(ii) the upper quartile
(iii) number of student scoring above $65$ marks.
(iv) If to students qualify for merit scholarship, find the minimum marks required to qualify.
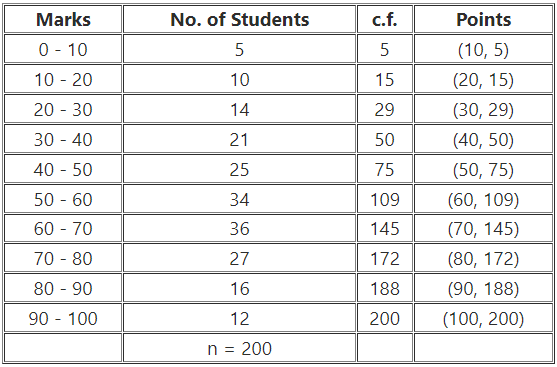
| Marks | $0 - 10$ | $10 - 20$ | $20 - 30$ | $30 - 40$ | $40 - 50$ | $50 - 60$ | $60 - 70$ | $70 - 80$ | $80 - 90$ | $90 - 100$ |
| No. of students | $5$ | $10$ | $14$ | $21$ | $25$ | $34$ | $36$ | $27$ | $16$ | $12$ |
From the graph find:
(i) the median
(ii) the upper quartile
(iii) number of student scoring above $65$ marks.
(iv) If to students qualify for merit scholarship, find the minimum marks required to qualify.