Questions

[5 marks sum]

🎯

Test yourself on this topic

14 questions · timed · auto-graded

Question 15 Marks
Use graph paper for this question.
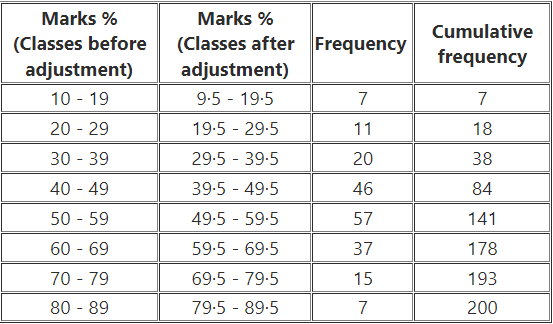
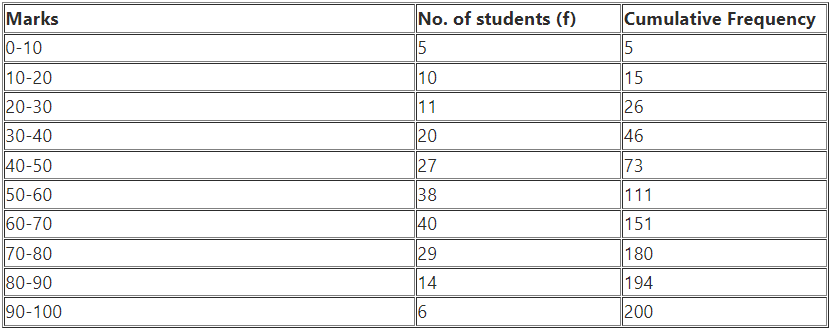
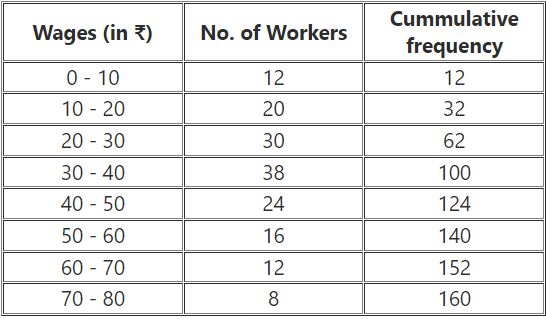
The table given below shows the monthly wages of some factory workers.
(i) Using the table, calculate the cumulative frequency of workers.
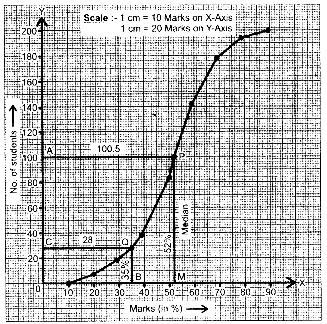
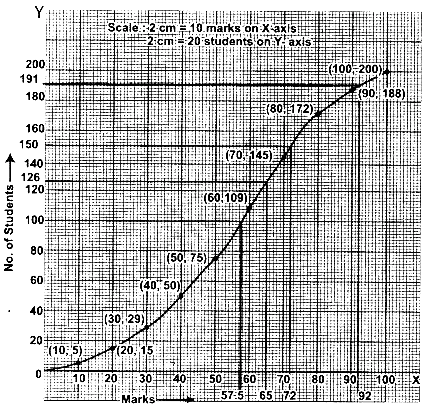
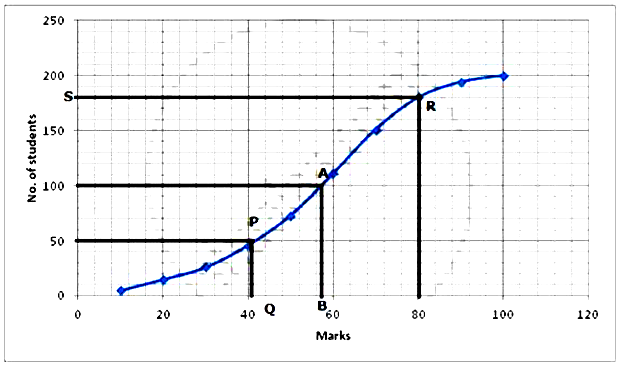
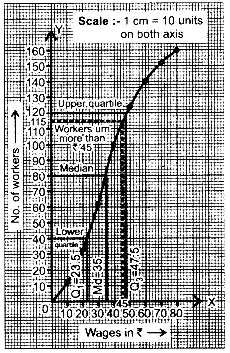
(ii) Draw the cumulative frequency curve.
Use 2 cm = ₹500, starting the origin at ₹6,500 on X-axis, and 2 cm = 100 worker at they Y-axis.
(iii) Use your graph to write down the median wages in ₹.
Wages in ₹
(CLass)
No. of workers (frequency)Cumulative frequency f(x)
6500 - 700010-
7000 - 750018-
7500 - 800022-
8000 - 850025-
8500 - 900017-
9000 - 950010-
9500 - 100008-
Answer
(i) Image

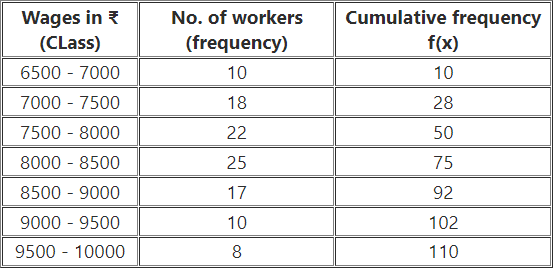
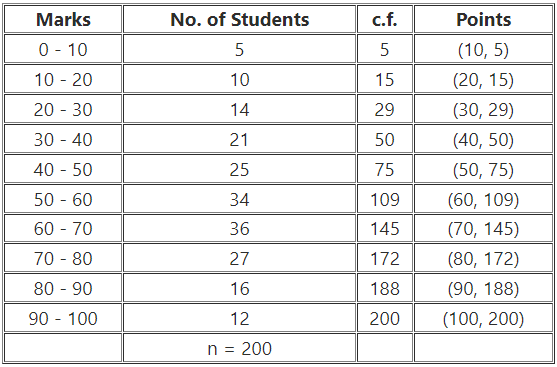
(ii) Plot the points (6500, 0), (7000, 10), (7500, 28), (8000, 75), (9000, 92), (9500, 102), (10000, 110) and join them by a free hand curve.
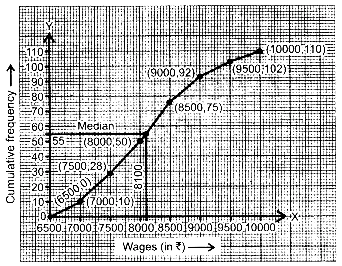

(iii) Here, N = 110
To find the median we shall construct a horizontal line at cumulative frequency
$=\frac{ N }{2}=\frac{110}{2}=55$,
intersecting the ogive at (8100, 55)
Hence, median wages = ₹8100.
View full question & answer
Question 25 Marks
The mark of 200 students in a test were recorded as follows:
Marks % No. of students
10 - 19 7
20 - 29 11
30 - 39 20
40 - 49 46
50 - 59 57
60 - 69 37
70 - 79 15
80 - 89 7
Draw the cumulative frequency table.
Draw an ogive and use it to find:
(i) The median
(ii) The number of students who scored more than 35% marks.
Answer
The given frequency distribution is discontinuous, to convert it into continuous distribution.
Adjustment factor $=\frac{20-19}{2}=0.5$.
Cumulative (continuous) frequency tab;e for the given data is :
Image
Take 1 cm along X-axis = 10% marks and 1 cm along Y-axis = 25 students.
Plot the point $(19·5, 7), (29·5 - 18), (39·5 - 38), (49·5 - 141), (69·5 - 178), (9·5 - 193), (89·5 - 200)$ and $(9·5 - 0)$ join these points by a free hand drawing.
The required ogive is drawn in the figure given below:


(i) To find the median: Let A be a point on Y-axis representing frequency
$=\frac{1}{2}\left(\left(\frac{ n ^{\text {th }}}{2} \text { term }\right)+\left(\frac{ n }{2}+1\right)^{\text {th }} \text { term }\right)$
$=\frac{1}{2}(100+101)$
$= 100.5.$
Through A draw a horizontal line to meet the ogive at P. Through P draw a vertical line to meet X-axis at M. the abscissae of point M represents $52\%.$
$\therefore $ The required median $= 52\%.$
(ii) Let the point B on X-axis represent 35% marks. Through B draw a vertical line to meet the ogive at Q. Through Q draw a horizontal line to meet Y-axis at C. The ordinate of the point C represents 28 students on Y-axis.
$\therefore $ The number of students who scored more than 35% marks = total no. of students - no. of students who scored ≤35%
$= 200 - 8$
$= 172.$
View full question & answer
Question 35 Marks
Attempt this question on graph paper. Marks obtained by $200$ students in examination are given below:
Marks $0 - 10$ $10 - 20$ $20 - 30$ $30 - 40$ $40 - 50$ $50 - 60$ $60 - 70$ $70 - 80$ $80 - 90$ $90 - 100$
No. of students $5$ $10$ $14$ $21$ $25$ $34$ $36$ $27$ $16$ $12$
Draw an ogive for the given distribution taking $2$ cm $= 10$ makrs on one axis and $2\ cm = 20$ students on the other axis.
From the graph find:
(i) the median
(ii) the upper quartile
(iii) number of student scoring above $65$ marks.
(iv) If to students qualify for merit scholarship, find the minimum marks required to qualify.
Answer
Image

(i) Let A be the point on y-axis representing frequency
Here, n (no. of student) $= 200$ (even)
$\text { Median }=\left(\frac{ n }{2}\right)^{\text {th }} \text { term }$
$=\left(\frac{200}{2}\right)^{\text {th }} \text { term }$
$=100^{\text {th }} \text { term }$
From the graph $100$th term $= 57.5$
(ii) Upper quartile = $\frac{3 n}{4}$
$=\frac{3 \times 200^{\text {th }}}{4} \text { term }$
$=\frac{600}{4}=150^{\text {th }} \text { term }$
From graph $150^{th}$​​​​​​​ term
The upper quartile $= 72$
(iii) No. of students scoring above $65$ marks
$\Rightarrow$ Total No. of students - No. of students scoring $\leq 65$ marks
$\Rightarrow 200 - 126$
$\Rightarrow 74$ (approx.)
(iv) From the above diagram, we observe the students from $191$ to $200$ qualify for merit scholarship.
$\therefore$ The student who qualifies for merit scholarship scores more than $91$ marks.
$\therefore$ The minimum marks required to qualify for merit scholarship $= 92$ (approx.).
View full question & answer
Question 45 Marks
The marks obtained by $200$ students in an examination are given below :
Marks $0-10$ $10-20$ $20-30$ $30-40$ $40-50$ $50-60$ $60-70$ $70-80$ $80-90$ $90-100$
No.of students $5$ $10$ $11$ $20$ $27$ $38$ $40$ $29$ $14$ $6$
Using a graph paper, draw an Ogive for the above distribution. Use your Ogive to estimate:
(i) the median;
(ii) the lower quartile;
(iii) the number of students who obtained more than $80\%$ marks in the examination and
(iv) the number of students who did not pass, if the pass percentage was $35.$
Use the scale as $2 cm = 10$ marks on one axis and $2 cm = 20$ students on the other axis.
Answer
We construct cumulative frequency table of the given distribution :
Image
Take a graph paper and draw both the axes.
On the $x$ - axis, take a scale of $1 cm=20$ to represent the marks.
On the $y$ - axis, take a scale of $1 cm=50$ to represent the no. of students.
Now, plot the points $(10 ,5) ,(20 ,15) ,(30 ,26) ,( 40 ,46) ,(50 ,73) ,(60 ,111), (70 ,151) ,(80 ,180) ,(90 ,194) ,(100 ,200) .$
Join them by a smooth curve to get the ogive.

(i) No. of terms = 200
∴ Median = $\frac{100+101}{2}$ = $100.5^th$ term
Through mark of $100.5$ on y-axis draw a line parallel to x-axis which meets the curve at A. From A, draw a perpendicular to x-axis which meets it at $B.$
The value of $B$ is the median which is $58.5.$
(ii) Lower Quartile ($Q_1$​​​​​​​) = $\frac{n}{4}=\frac{200}{4}=50^{\text {th }}$ term
Through mark of 50 on $y$-axis draw a line parallel to $x$-axis which meets the curve at $P$. From $P$, draw a perpendicular to x -axis which meets it at $Q .$
The value of $Q$ is the lower quartile which is 41 .
$(iii)$ From marks $=80$ draw a line parallel to $y$-axis and meet the curve at R. From R, Draw a perpendicular on $y$-axis which meets it at S. The difference of the value obtained when subtracted from 200 gives the number of students who scored more than $80 \%$.
$\Rightarrow 200-180=20$
$20$ students scored more than $80 \%$
View full question & answer
Question 55 Marks
The marks obtained by $100$ students in a Mathematics test are given below:
Marks $0 - 10$ $10 - 20$ $20 - 30$ $30 - 40$ $40 - 50$ $50 - 60$ $60 - 70$ $70 - 80$ $80 - 90$ $90 - 100$
No. of Students $3$ $7$ $12$ $17$ $23$ $14$ $9$ $6$ $5$ $4$
Draw an ogive for the given distribution on a graph sheet.
(Use a scale of $2 cm = 10$ units on both axis).
use the ogive to estimate the :
(i) median.
(ii) lower quartile.
(iii) number of students who obtained more than 85% marks in the test.
(iv) number of students who did not pass in the test if the pass percentage was $35.$
Answer
Image

(i) Median $=\left(\frac{ n }{2}\right)^{\text {th }}$ observation
$=\left(\frac{100}{2}\right)^{\text {th }}$ observation
$= 50^{th}$​​​​​​​ observation
$= 45.$
(ii) Lower Quartile $\left( Q _1\right)=\left(\frac{ N }{2}\right)^{ th }$ observation
$=\left(\frac{100}{4}\right)^{\text {th }}$ observation
$= 25^{th}$ observation
$= 32.$
(iii) Number of students who obtained more than $85\%$ marks
$= (100 - 94)$
$= 6.$
(iv) Number of students who did not pass if passing $\%$ of marks is $35$
$= 30.$
View full question & answer
Question 65 Marks
The daily wages of $160$ workers in a building project are given below:
Wages in ₹ $0 - 10$ $10 - 20$ $20 - 30$ $30 - 40$ $40 - 50$ $50 - 60$ $60 - 70$ $70 - 80$
No. of Workers $12$ $20$ $30$ $38$ $24$ $16$ $12$ $8$
Using a graph paper, draw in Ogive for the above distribution.
Use your Ogive to estimate :
(i) the median wage of the workers.
(ii) the upper quartile wage of the workers
(iii) the lower quartile wages of the workers
(iv) the percentage of workers who earn more than ₹ $45$ a day.
Answer
Image

(i) Median $=\left(\frac{ n }{2}\right)^{\text {th }}$ observation
$=\left(\frac{160}{2}\right)^{\text {th }}$ observation
$= 80^{th}$​​​​​​​ observation
Now the $80^{th}​​​​​​​$​​​​​​​ position in the ogive diagram represent the median wage of workers by the graph $= 35.$
(ii) Upper quartile = $\left(\frac{3 n}{4}\right)^{\text {th }}$ observation
$=\left(\frac{3 \times 160}{4}\right)^{\text {th }} \text { observation }$
$=120^{\text {th }} \text { observation }$
(iii) Lower quartile $=\left(\frac{ n }{4}\right)^{\text {th }}$ observation
$=\left(\frac{160}{4}\right)^{\text {th }}$ observation
$40^{\text {th }}$ observation
The $40^{\text {th }}$ observation in the ogive diagram represents wage of the workers $Q_1=23.5$
(iv) The percentage of workers earmore than ₹45
$=\frac{160-115}{100} \times 100$
$=\frac{45 \times 10}{16}$
$= 28.25\%.$
View full question & answer
Question 75 Marks
Marks obtained by 40 students in a short assessment is given below, where a and b are two missing data.
Marks56789
Number of Students6a1613b
If the mean of the distribution is 7.2, find a and b.
Answer
Marks (x)Number of students (f)fx
5630
6a6a
716112
813104
9b9b
`sumf = 34 + a + b``sumfx = 246 + 6a + 9b`
It is given that the number of students is 40.
∴ 35 + a + b = 40
⇒ a + b – 5 = 0      ....(1)
"Mean" = (sum fx)/(sum f)
=> (246 + 6a + 9b)/(35 + a + b) = 7.2`
=> 246 + 6a + 9b = 7.2(35 + a + b)`
=> 246 + 6a + 9b = 252 + 7.2a  + 7.2b`
=> 0 = 252 - 246 + 7.2a - 6a + 7.2b - 9b`
=> 6 + 1.2a - 1.8b = 0`
=> 10 + 2a - 3b = 0`    .... (2)
Solving equations (1) and (2), we have
5a - 5 = 0
=> a = 1
From (1), we have b = 4
Hence, the values of a and b are 1 and 4 respectively.
View full question & answer
Question 85 Marks
For the following frequency distribution find:
(i) Lower quartile
(ii) Upper quartile
(iii) Inter quartile range
(iv) Semi-inter quartile range.
$x$ $1$ $2$ $3$ $4$ $5$ $6$ $7$ $8$
$y$ $3$ $5$ $9$ $15$ $20$ $16$ $10$ $2$
Answer
Image
(i) Lower quartile
($Q_1$​​​​​​​) = The value of $\left(\frac{ n }{4}\right)^{\text {th }}$ observation
$=$ The value of (804)th observation
$=$ The value of $20^{\text {th }}$ observation $Q _1=4$.
(ii) Upper quartile
$\left(Q_3\right)=$ The value of $(3 n 4)$ th observation
$=$ The value of $(3 \times 804)$ th observation
$=$ The value of $60^{\text {th }}$ observation
$\therefore Q_3 = 6.$
(iii) Inter quartile range
$= Q_3 - Q_1$
$= 6 - 4$
$= 2.$
(iv) Semi-quartile range
$=\frac{Q_3-Q_1}{2}$
$=\frac{2}{2}$
$= 1.s$
View full question & answer
Question 95 Marks
Calculate the mean of the distribution given below using the short cut method.
Marks $11 - 20$ $21 - 30$ $31 - 40$ $41 - 50$ $51 - 60$ $61 - 70$ $71 - 80$
No. of students $2$ $6$ $10$ $12$ $9$ $7$ $4$
Answer
Image
$\therefore \text { Mean }=A+\frac{\sum f d}{\sum f}$
$ =45.5+\frac{70}{50}$
$ =45.5+\frac{7}{5} $
$ =\frac{227.5+7}{5}$
$=\frac{234.5}{5} $
$ =46.9$
View full question & answer
Question 105 Marks
Using step-deviation method, calculate the mean marks of the following distribution
Class Interval $50 - 55$ $55 - 60$ $60 - 65$ $65 - 70$ $70 - 75$ $75 - 80$ $80 - 85$ $85 - 90$
Frequency $5$ $20$ $10$ $10$ $9$ $6$ $12$ $8$
Answer
Image
$\therefore \text { Mean } X = A +\frac{\sum f \cdot u}{\sum f} \times i \quad .[ i =\text { length of C.I. }] $
$ =67.5+\frac{24}{80} \times 5$
$ =67.5+1.5 $
$ =69 .$
View full question & answer
Question 115 Marks
A frequency distribution of the life times of 400 T.V., picture tubes leased in tube company is given below. Find the average life of tube:
Life time (in hrs) Number of tubes
300 - 399 14
400 - 499 46
500 - 599 58
600 - 699 76
700 - 799 68
800 - 899 62
900 - 999 48
1000 - 1099 22
1100 - 1199 6
Answer
Here, the class-intervals are formed by exclusive method. If we make the series an inclusive one the mid-values remain same. So, there is no need to convert the series.
Let the assumed mean be A = 749·5 and h = 100.
Image
Here,
$N = 400, A = 749·5, h = 100$ and $\sum f_i \mu_i=-138$
$\therefore X = A +\frac{ h }{ N } \sum f_i \mu_i$
$\Rightarrow X =749 \cdot 5+100 \times\left(\frac{-138}{400}\right)$
$=749 \cdot 5-\frac{138}{4}$
$= 749.5 - 34.5$
$= 715.$
Hence, the average life time of a tube is $715$ hours.
View full question & answer
Question 125 Marks
The weights of $50$ apples were recorded as given below. Calculate the mean weight, to the nearest gram. by the Step Deviation Method.
Weights in grams No. of apples
$80 - 55$ $5$
$85 - 90$ $8$
$90 - 95$ $10$
$95 - 100$ $12$
$100 - 105$ $8$
$105 - 110$ $4$
$110 - 115$ $3$
Answer
Image
$A =97.5, \sum f_i=50, \sum f_i u_i=-16, h =5 . $
$\therefore \text { Mean } \overline{ X }= A +\frac{\sum f_i u_i}{\sum f_i} \times h$
$ =90 \cdot 5+\frac{-16}{50} \times 5$
$= 95.9.$
View full question & answer
Question 135 Marks
Helping the step deviation method find the arithmetic mean of the distribution:
Variable (x) 5 10 15 20 25 30 35 40 45 50
Frequency(f) 20 43 75 67 72 45 39 9 8 6
Answer
Let the assumed Mean be A = 25 and h = 5.
Image
We have,
N = 384, A = 25, h = 5 and $\sum f_i u_i=-214$
Mean $\overline{( X )}= A + h \left(\frac{1}{ N } \sum f_i u_i\right)$
$=25+5 \times\left(\frac{-214}{384}\right)$
= 25 - 2.786
= 22.214.
View full question & answer
Question 145 Marks
The average score of girls in class $X$ examination in school is $67$ and that of boys is $63$. The average score for the whole class is $64.5$. Find the percentage of girls and boys in the class.
Answer
Let the number of boys and girls in the class be $n_1$ and $n_2$ respectively.
We have
$\bar{X}_1$ = Average score of girls $= 67$
$\bar{X}_2$= Average score of boys $= 63$
$\bar{X}$= Average score of the whole class $= 64.5$
$\therefore \overline{ X }=\frac{ n _1 \overline{ X }_1+ n _2 \overline{ X }_2}{ n _1+ n _2}$
$\Rightarrow 64 \cdot 5=\frac{67 n _1+63 n _2}{ n _1+ n _2}$
$\Rightarrow 64 \cdot 5 n _1+64 \cdot 5 n _2=67 n _1+63 n _2$
$\Rightarrow 2 \cdot 5 n _1=1 \cdot 5 n _2$
$\Rightarrow 25 n _1=15 n _2$
$\Rightarrow 5 n _1=3 n _2$
Total number of students in the class $= n _1+ n _2$
$\therefore \text { Percentage of girls }=\frac{n_1}{n_1+n_2} \times 100$
$=\frac{n_1}{n_1+\frac{5 n_1}{3}} \times 100, \quad \ldots\left[\because 5 n_1=3 n_2\right]$
$=\frac{3 n_1}{3 n_1+5 n_1} \times 100$
$=\frac{3}{8} \times 100$
$= 37·5\%$
and
Percentage of boys = $\frac{ n _2}{ n _1+ n _2} \times 100$
$=\frac{ n _2}{\frac{3 n _2}{5}+ n _2} \times 100$
$=\frac{5 n _2}{3 n _2+5 n _2} \times 100$
$= 62.5\%$.
Hence, there are $37.5\%$ girls and $62.5\%$ boys in the class.
View full question & answer