Question
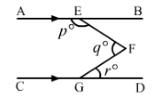
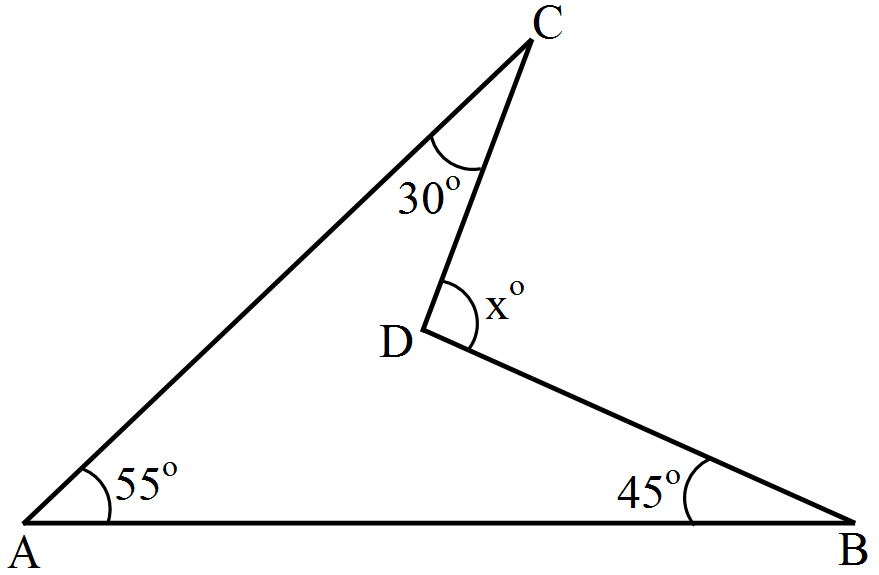
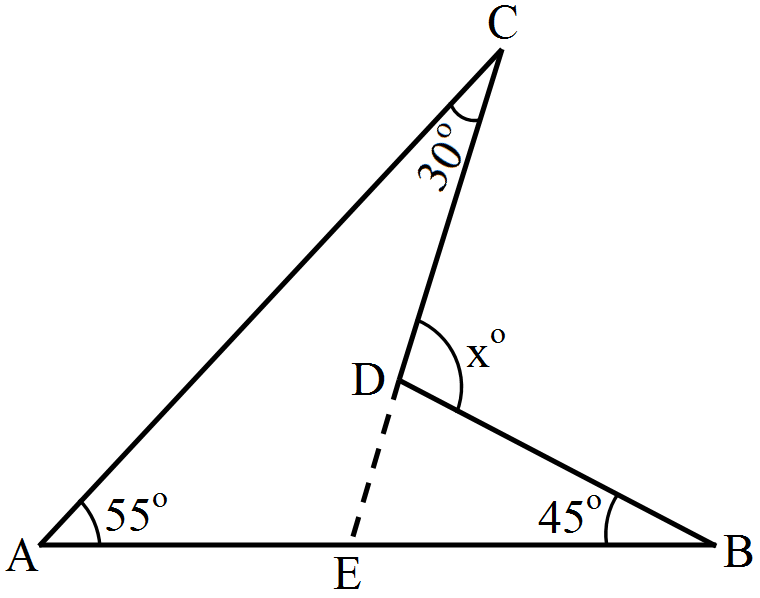
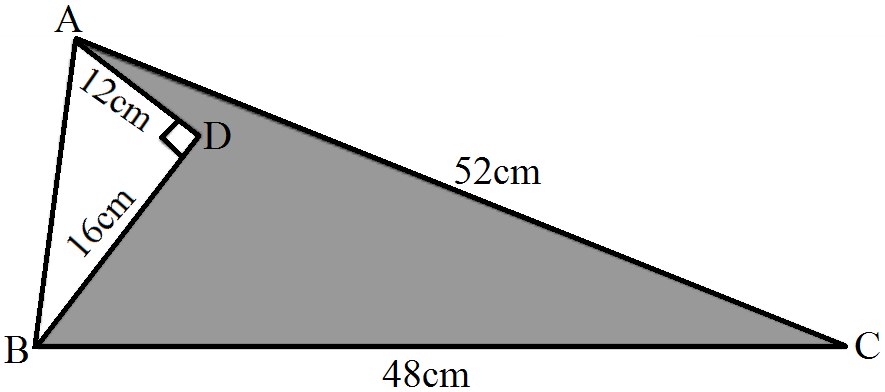
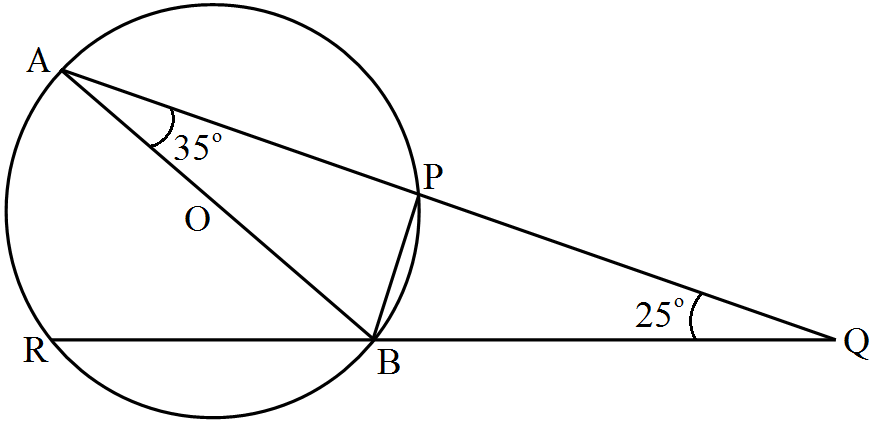
Calculate the value of $x$ in the given figure.

Answer

Produce $CD$ to cut $AB$ at $E$.
 
Now, in $\triangle\text{BDE},$
we have, Exterior $\angle\text{"CDB}=\angle\text{CEB}+\angle\text{DBE}$
$\Rightarrow\text{x}^\circ=\angle\text{CEB}+45^\circ\ ....(\text{i)}$ In
$\triangle\text{AEC}$ we have, Exterior $\angle\text{CEB}=\angle\text{CAB}+\angle\text{ACE}$
$55^\circ+30^\circ=85^\circ$ Putting $\angle\text{CEB}=85^\circ$ in $(i)$,
we get, $\text{x}^\circ=85^\circ+45^\circ=130^\circ$
 $\therefore\text{x}=130$

Need a full question paper?

Generate a complete, print-ready paper with questions like this in minutes — across 16+ boards, with answer keys.

Start Generating Free

Similar questions

The diameter of a cylinder is $28\ cm$ and its height is $40\ cm$. Find the curved surface, total surface area and the volume of the cylinder.
Find the area of the shaded region in the figure given below..
 
In the given figure, $AB$ is a diameter of the circle such that $\angle\text{A}=35^\circ$ and $\angle\text{Q}=25^\circ,$ find $\angle\text{PBR.}$
 
$\triangle ABC$ and $\triangle DBC$ are two isosceles triangles on the same base $BC$ and vertices $A$ and $D$ are on the same side of $BC$ . If $A D$ is extended to intersect $B C$ at $P$, show that :
$1. \triangle ABD \cong \triangle ACD$
$2. \triangle ABP \cong \triangle ACP$
$3. AP$ bisects $\angle A$ as well as $\angle D$
$4. AP$ is the perpendicular bisector of $BC.$

Find the values of $a$ and $b$ if $\frac{7+3 \sqrt{5}}{3+\sqrt{5}}-\frac{7-3 \sqrt{5}}{3-\sqrt{5}}=a+b \sqrt{5}$.
A design is made on a rectangular tile of dimensions $50cm \times 70cm$ as shown in the design shows $8$ triangles, each of sides $26\ cm, 17\ cm$ and $25\ cm$. Find the total area of the design and the remaining area of the tile.
If $p(y) = 4 - 3y -y^2 + 5y^3$, find:
$i. p(0)$
$ii. p(2)$
$iii. p(-1)$
A teacher wanted to analyse the performance of two sections of students in a mathematics test of $100$ marks. Looking at their performances, she found that a few students got under $20$ marks and a few got $70$ marks or above. So she decided to group them into intervals of varying sizes as follows: $0 - 20, 20 - 30, . . ., 60 - 70, 70 - 100.$ Then she formed the following table:
Marks Number of students
$0 - 20$ $7$
$20 - 30$ $10$
$30 - 40$ $10$
$40 - 50$ $20$
$50 - 60$ $20$
$60 - 70$ $15$
$70 -$ above $8$
Total $90$
Draw a histogram for this table$?$
Represent each of the numbers $\sqrt{5}, \sqrt{6}$ and $\sqrt{7}$ the real line.