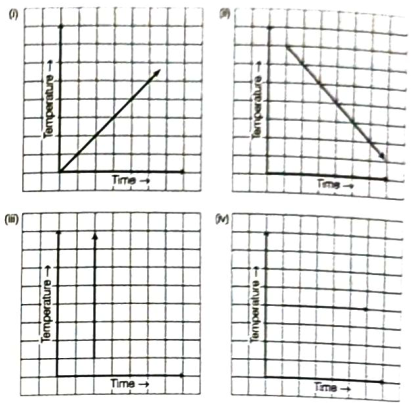
We know that if time is increasing, then temperature will either be increase or decrease or constant.
(i) Yes, it is the time-temperature graph, because it shows increase in temperature with increase in time.
(ii) Yes, it is the time-temperature graph, because it shows decrease in temperature with increase in time.
(iii) No, it is not the time-temperature graph, because it shows that at a particular time temperature increase (i.e. different temperature) which is not possible.
(iv) Yes, it is the time-temperature graph, because it shows that at different time (or increasing time) temperature is constant (or same).