MCQ
Consider a process shown in the figure. During this process the work done by the system
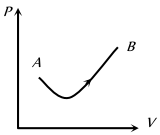
Image

  • Continuously increases
  • B
    Continuously decreases
  • C
    First increases, then decreases
  • D
    First decreases, then increases

Answer

Correct option: A.
Continuously increases
(a) As the volume is continuously increasing and the work of expansion is always positive, so the work done by the system continuously increases.

Need a full question paper?

Generate a complete, print-ready paper with questions like this in minutes — across 16+ boards, with answer keys.

Start Generating Free

Similar questions

Different voltages are applied across a $P-N$ junction and the currents are measured for each value. Which of the following graphs is obtained between voltage and current
A body moving with velocity $v$ has momentum and kinetic energy numerically equal. What is the value of $v$
The acceleration due to gravity at pole and equator can be related as
In our solar system, there is one sun and
A small piece of wire bent into an $L$ shape with upright and horizontal portions of equal lengths, is placed with the horizontal portion along the axis of the concave mirror whose radius of curvature is $10 \mathrm{~cm}$. If the bend is $20 \mathrm{~cm}$ from the pole of the mirror, then the ratio of the lengths of the images of the upright and horizontal portions of the wire is
Two tuning forks, $A$ and $B$, give 4 beats per second when sounded together. The frequency of $A$ is $320 \mathrm{~Hz}$. When some wax is added to $B$ and it is sounded with $A, 4$ beats per second are again heard. The frequency of $B$ is
In the arrangement shown in figure the ends $P$ and $Q$ of an unstretchable string move downwards with uniform speed $U$. Pulleys $A$ and $B$ are fixed. Mass $M$ moves upwards with a speed
Image
A gas is being compressed adiabatically. The specific heat of the gas during compression is
The $V$ - $i$ graph for a conductor at temperature $T_1$ and $T_2$ are as shown in the figure. $\left(T_2-T_1\right)$ is proportional to

Image

A body moves from rest with a constant acceleration. Which one of the following graphs represents the variation of its kinetic energy $K$ with the distance travelled $x$ ?