Question
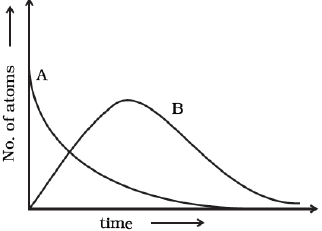
Consider a radioactive nucleus $A$ which decays to a stable nucleus $C$ through the following sequence$: A \rightarrow B \rightarrow C$
Here $B$ is an intermediate nuclei which is also radioactive. Considering that there are $N_0$ atoms of $A$ initially, plot the graph showing the variation of number of atoms of $A$ and $B$ versus time.
Here $B$ is an intermediate nuclei which is also radioactive. Considering that there are $N_0$ atoms of $A$ initially, plot the graph showing the variation of number of atoms of $A$ and $B$ versus time.