Question
Draw a graph for each table given below
(i)
(ii)
(i)
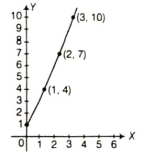
| $x$ | 0 | 1 | 2 | 3 |
| $y$ | 1 | 4 | 7 | 10 |
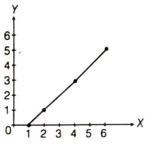
| $x$ | 1 | 2 | 4 | 6 |
| $y$ | 0 | 1 | 3 | 5 |
| $x$ | 0 | 1 | 2 | 3 |
| $y$ | 1 | 4 | 7 | 10 |
| $x$ | 1 | 2 | 4 | 6 |
| $y$ | 0 | 1 | 3 | 5 |
| $x$ | 0 | 1 | 2 | 3 |
| $y$ | 1 | 4 | 7 | 10 |
| $x$ | 1 | 2 | 4 | 6 |
| $y$ | 0 | 1 | 3 | 5 |
Generate a complete, print-ready paper with questions like this in minutes — across 16+ boards, with answer keys.
|
Items
|
Food
|
Entertainment
|
Other expenditure
|
Savings
|
|
Expenditure
|
$40\%$
|
$25\%$
|
$20\%$
|
$15\%$
|
|
Daily earnings (in Rs.)
|
$450-500$
|
$500-550$
|
$550-600$
|
$600-650$
|
$650-700$
|
|
Numbers of stores
|
$16$
|
$10$
|
$7$
|
$3$
|
$1$
|