Question
Draw a scatter diagram for:
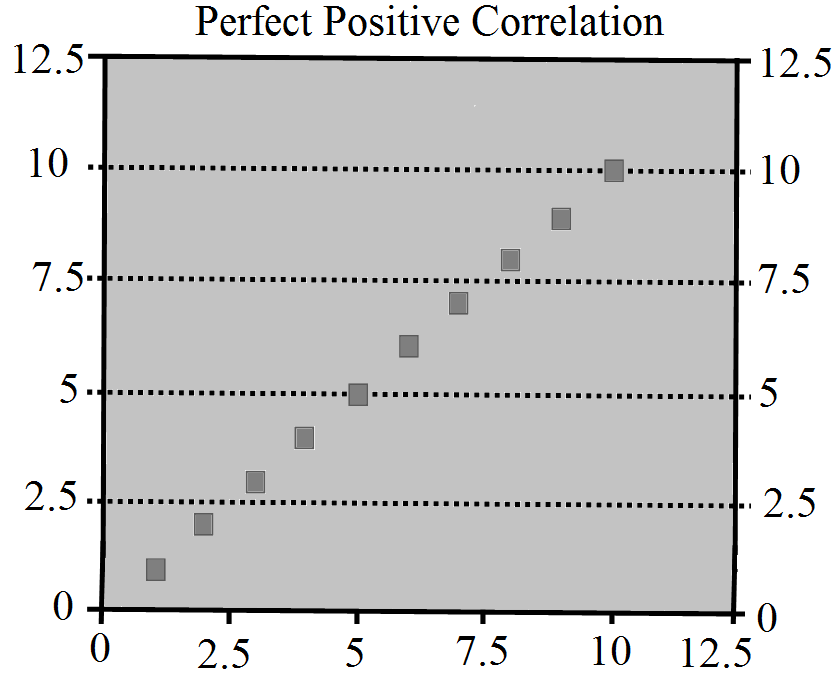
  1. Perfect positive correlation.
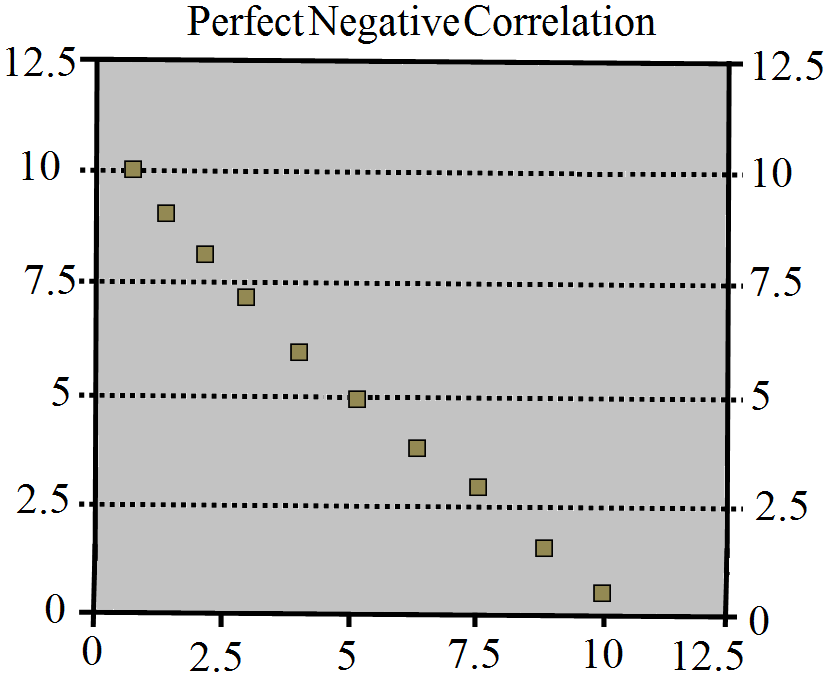
  2. Perfect negative correlation.
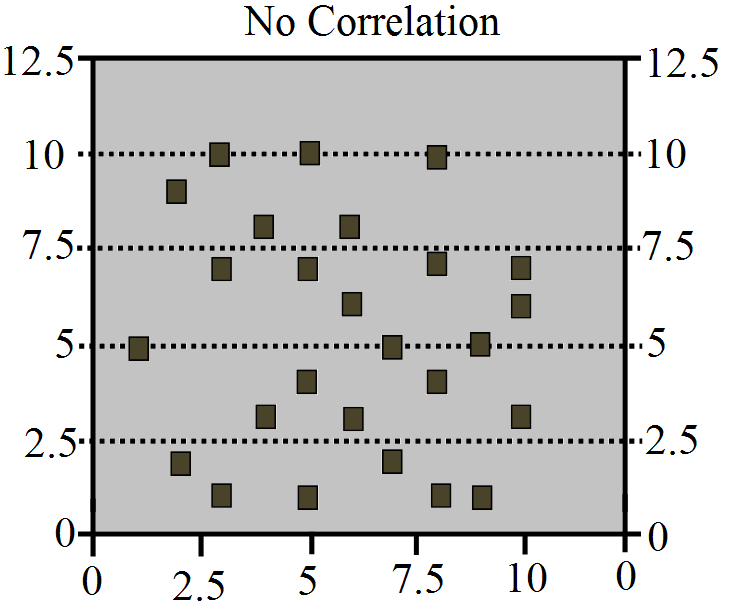
  3. Zero correlation.
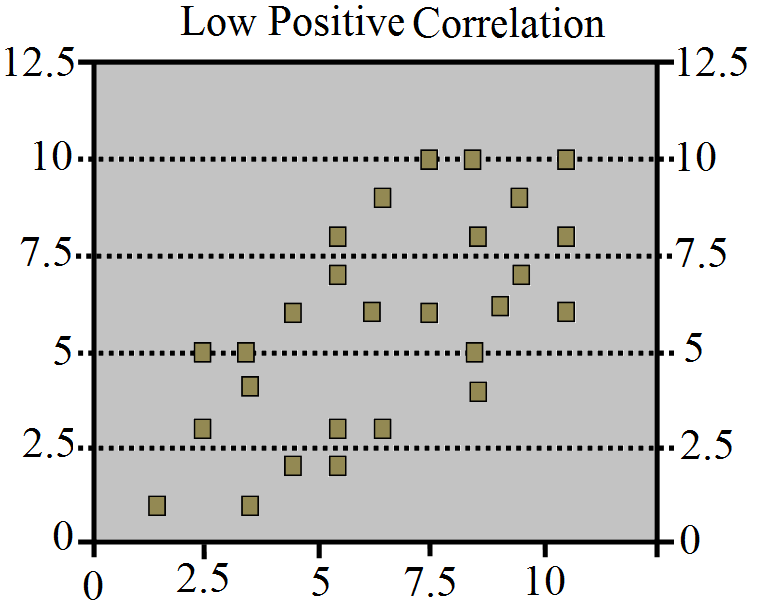
  4. Low positive correlation.
  5. low negative correlation.
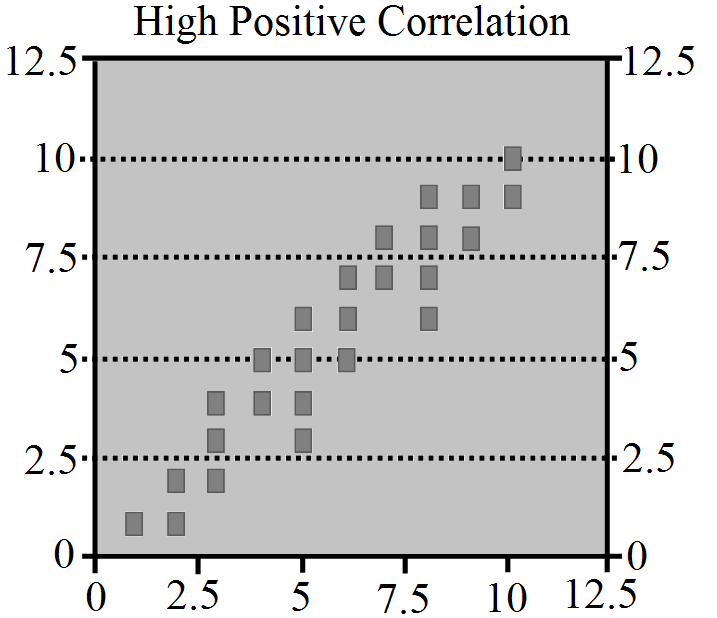
  6. High positive correlation.

Answer

  1.  
  1.  
  1.  
  1.  

Need a full question paper?

Generate a complete, print-ready paper with questions like this in minutes — across 16+ boards, with answer keys.

Start Generating Free

Similar questions

Discuss the importance of Statistics in Business.
What do you understand by price elasticity of demand? How is it measured? Explain.
Calculate the standard deviation from the given data.
$10, 15, 20, 25, 30, 35, 40$
What is an ogive? How is it constructed?
From the following data, calculate coefficient of correlation between age and playing habits.
Age Group
20-30
30-40
40-50
50-60
60-70
Number of Students
25
60
40
20
20
Number of Regular Players
10
30
12
2
1
Find the Inter-Quartile range and coefficient of quartile deviation from the following data:
X 11-20 21-30 31-40 41-50 51-60
f 4 8 20 12 6
“The degree of closeness of scatter points and their overall direction gives us an idea of the nature of the relationship between variables.” True or False. Justify your answer.
State relation between mean, median and mode in normal and skewed distribution with an example.
Compute Karl Pearson's coefficient of correlation by direct method and interpret the result:
Marks in Mathematics 15 18 21 24 27
Marks in Accountancy 25 25 27 31 32