Rajasthan BoardEnglish MediumSTD 11 ScienceBIOLOGYMODEL PAPER 33 Marks
Question
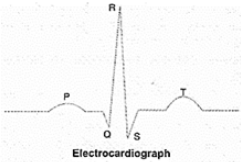
Draw a standard ECG and explain the different segments in it.
✓
Answer
The P-wave represents the electrical excitation (or depolarisation) of the atria, which leads to the contraction of both the atria. The QRS complex represents the depolarisation of the ventricles, which initiates the ventricular contraction. The contraction starts shortly after Q and marks the beginning of the systole. The T-wave represents the return of the ventricles from excited to the normal state (repolarization). The end of the T-wave marks the end of systole. Obviously, by counting the number of QRS complexes that occur in a given time period, one can determine the heartbeat rate of an individual. Since the ECGs obtained from different individuals have roughly the same shape for a given lead configuration, any deviation from this shape indicates a possible abnormality or disease. Hence, it is of great clinical significance.
Need a full question paper?
Generate a complete, print-ready paper with questions like this in minutes — across 16+ boards, with answer keys.