Question
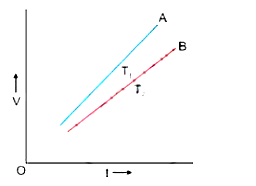
Draw a V-I graph for a conductor at two different temperature. What conclusion do you draw from your graph for the variation of resistance of conductor with temperature?
Generate a complete, print-ready paper with questions like this in minutes — across 16+ boards, with answer keys.
The total current taken from the supply