Question
Draw Average Variable Cost (AVC), Average Total Cost (ATC) and Marginal Cost (MC) curves in a single diagram. State the relation between MC curve and AVC & ATC curves.
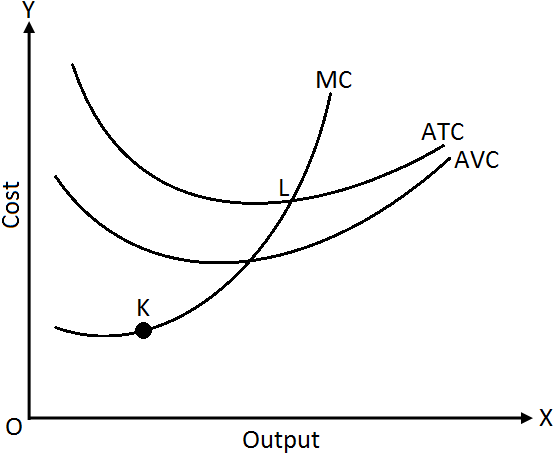 Relationship among MC, AVC & AC:
Generate a complete, print-ready paper with questions like this in minutes — across 16+ boards, with answer keys.
| Price (₹) | 1 | 2 | 3 | 4 | 5 | 6 | 7 |
| Units Sold | 100 | 90 | 80 | 70 | 60 | 50 | 40 |