Question
Draw distance-time graph to show:
Decreasing velocity

Answer


As slope of this line is negative so this represent decreasing velocity.

Need a full question paper?

Generate a complete, print-ready paper with questions like this in minutes — across 16+ boards, with answer keys.

Start Generating Free

Similar questions

Given:
Mass of the earth $= 6X10^{24}kg.$
Radius of the earth $= 6.4 X 10^6 m$
$G = 6.7 x 10^{11}Nm^2kg^{-2}$​​​​​​​
Using this data, calculate the force of gravity due to the earth acting on a $100 \ kg$ person stannding on the ground.
An object 10 cm high is placed at a distance of 20 cm in front of a spherical mirror of focal length 25 cm. By scale drawing find the nature, position, and magnification of the image in the following case:
Concave mirror
Explain why a gas bubble released at the bottom of a lake grows in size as it rises to the surface of the lake.
The following figure shows a metal rod PQ mounted on an insulated stand. The cap of an uncharged electroscope touches one end Q of the metal rod. A negatively charged ebonite rod is brought near the other end P of the metal rod.
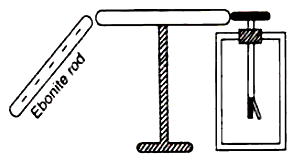
(a) What charge does the end P have?
(b) What charge does the end Q have?
(c) What charge does the cap of the electroscope have?
(d) What charge does the gold leaf have?
(e) Will the leaf diverge or collapse? Give reason.
(f) If the electroscope is now earthed, what charge does the metal rod have?
A cube of ice whose side is 4.0 cm is allowed to melt. The volume of water formed is found to be $58.24 cm^2$. Find the density of ice.
A solid weighs 120 gf in air and and 105 gf when it is completely immersed in water. Calculate the relative density of solid.
A boy is standing in front of a plane mirror at a distance of 3 m from it.
(i) What is the distance between the boy and his image?
(ii) If the boy moves 1 m backward, find the distance between the image and the boy.
Differentiate between the scalar and vector quantities, giving two examples of each.
Explain the following term:
Reflected ray
Draw diagram/diagrams to show them.
Draw a displacement-time graph for a boy going to school with uniform velocity.