Question
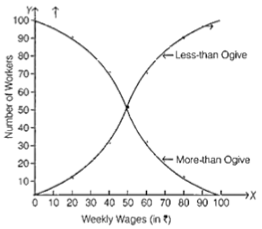
Draw the ‘less-than’ and ‘more-than’ ogive from the data given below
| Weekly Wages (in Rs.) | Number of Workers |
| 0-20 | 10 |
| 20-40 | 20 |
| 40-60 | 40 |
| 60-80 | 20 |
| 80-100 | 10 |
| Weekly Wages (in Rs.) | Number of Workers |
| 0-20 | 10 |
| 20-40 | 20 |
| 40-60 | 40 |
| 60-80 | 20 |
| 80-100 | 10 |
| Less-than Distribution | More-than Distribution | ||
| Weekly Wages (in Rs.) | Number of Workers | Weekly Wages (in Rs.) | Number of Workers |
| Less than 20 | 10 | More than 0 | 100 |
| Less than 40 | 30 | More than 20 | 90 |
| Less than 60 | 70 | More than 40 | 70 |
| Less than 80 | 90 | More than 60 | 30 |
| Less than 100 | 100 | More than 80 | 10 |
Generate a complete, print-ready paper with questions like this in minutes — across 16+ boards, with answer keys.
|
Output (units)
|
Price (₹)
|
Total Revenue (₹)
|
Marginal Revenue (₹)
|
|
4
|
9
|
36
|
__
|
|
5
|
__
|
__
|
4
|
|
6
|
__
|
42
|
__
|
|
7
|
6
|
__
|
__
|
|
8
|
__
|
40
|
__
|
| Output (units) | Price (₹) | Total Revenue | Marginal Revenue (₹) |
|
1
|
7
|
-
|
-
|
|
2
|
6
|
-
|
-
|
|
3
|
4
|
-
|
-
|
|
4
|
2
|
-
|
-
|
| Year | Profit (in Rs. '000) |
| 2006 | 60 |
| 2007 | 72 |
| 2008 | 75 |
| 2009 | 65 |
| 2010 | 80 |
| 2011 | 95 |