Question
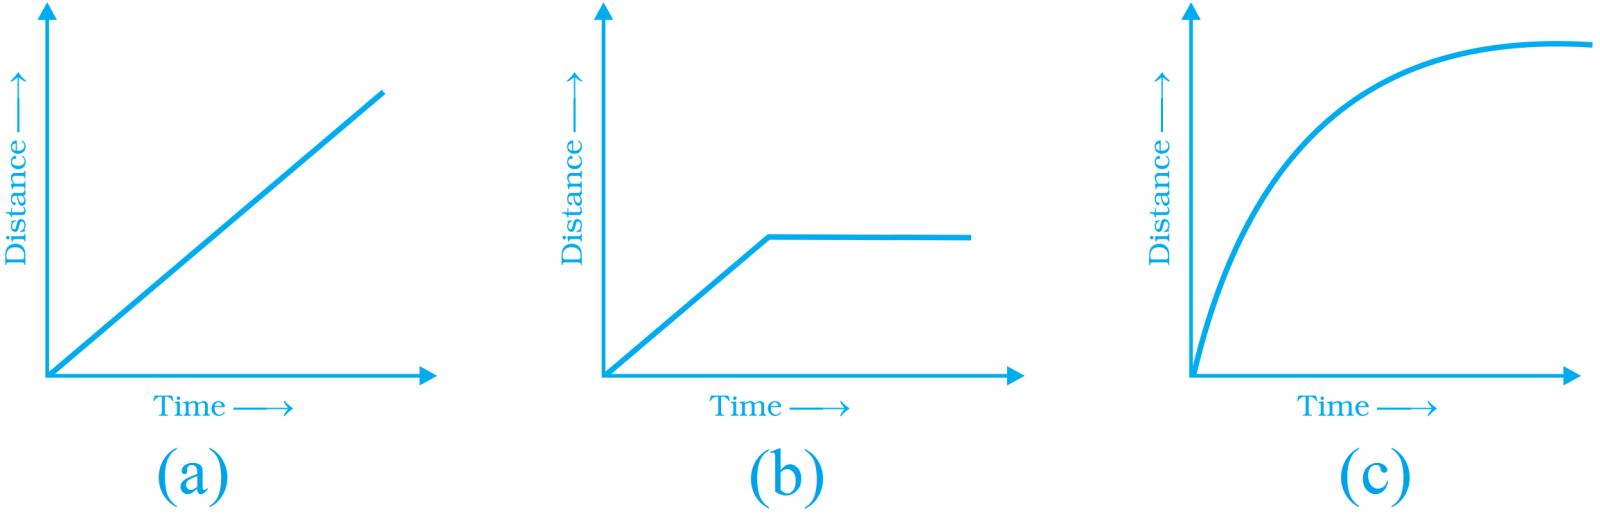
Explain the situations represented by the following distance$-$time graphs.
Generate a complete, print-ready paper with questions like this in minutes — across 16+ boards, with answer keys.
|
$x$
|
$6$
|
$8$
|
$10$
|
$...$
|
$20$
|
|
$y$
|
$15$
|
$20$
|
$...$
|
$40$
|
$...$
|