Question 13 Marks
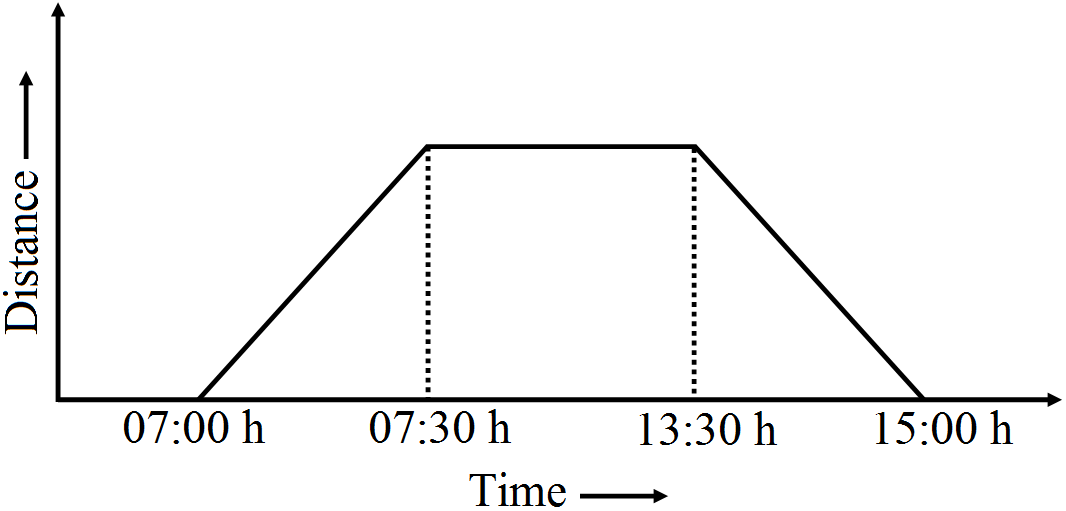
Ajita starts off from home at $07.00$ hours with her father on a scooter that goes at a uniform speed of $30\ km/h$ and drops her at her school after half an hour. She stays in the school till $13.30$ hours and takes an auto rickshaw to return home. The rickshaw has a uniform speed of $10\ km/h$. Draw the graph for the above situation and also determine the distance of Ajita’s school from her house.
AnswerUniform speed of ajita's father on scooter $= 30km/h$ Time take by her father to drop ajita to her school $=\frac{1}{2}\text{h on}\ 30\text{min}$
$\therefore\ $Distance between ajita's school and her home $=30\times\frac{1}{2}=15\text{km}$ [$\because\ $disitance = speed $\times$ time] Distance cover in $1$ min $=\frac{15}{30}=\frac{1}{2}\text{km}=500\text{m}$
View full question & answer→Question 23 Marks
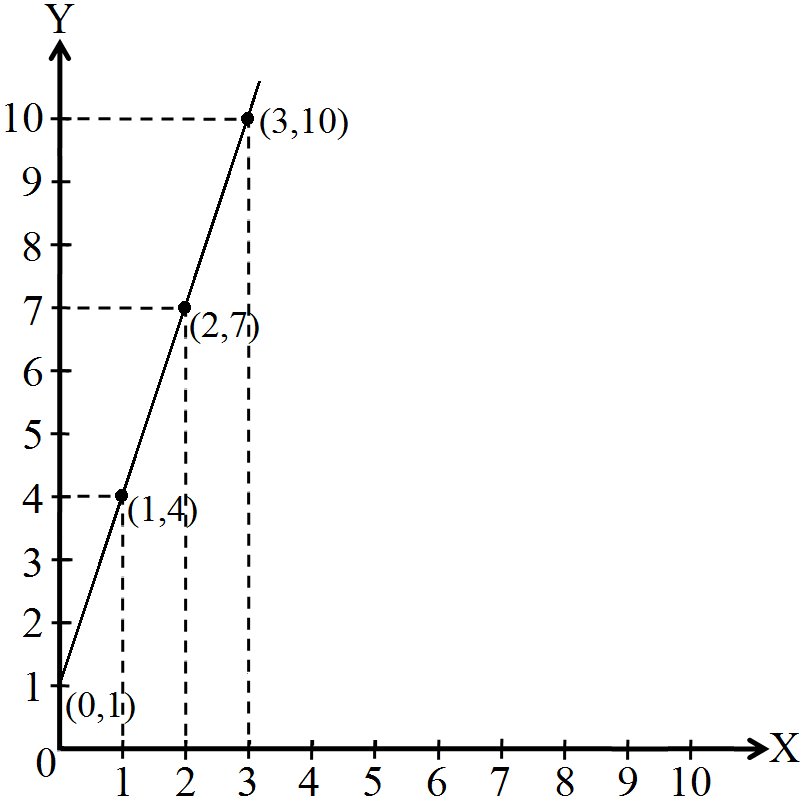
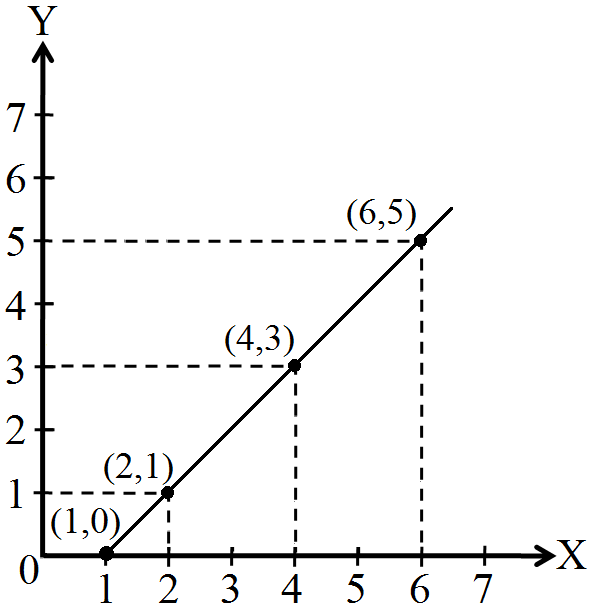
Complete the given tables and draw a graph for each.
$a.$
|
$x$
|
$0$
|
$1$
|
$2$
|
$3$
|
|
$y = 3x + 1$
|
$1$
|
$4$
|
$-$
|
$-$
|
$b.$
|
$x$
|
$1$
|
$2$
|
$4$
|
$6$
|
|
$y = x - 1$
|
$0$
|
$-$
|
$-$
|
$-$
|
Answer$a. $
|
$x$
|
$0$
|
$1$
|
$2$
|
$3$
|
|
$y = 3x + 1$
|
$1$
|
$4$
|
$7$
|
$10$
|
$b. $
|
$x$
|
$1$
|
$2$
|
$4$
|
$6$
|
|
$y = x - 1$
|
$0$
|
$1$
|
$3$
|
$5$
|
View full question & answer→Question 33 Marks
As part of his science project, Prithvi was supposed to record the temperature every hour one Saturday from $6\ am$ to midnight. At noon, he was taking lunch and forgot to record the temperature. At $8:00\ pm$, his favourite show came on and so forgot again. He recorded the data so collected on a graph sheet as shown below.
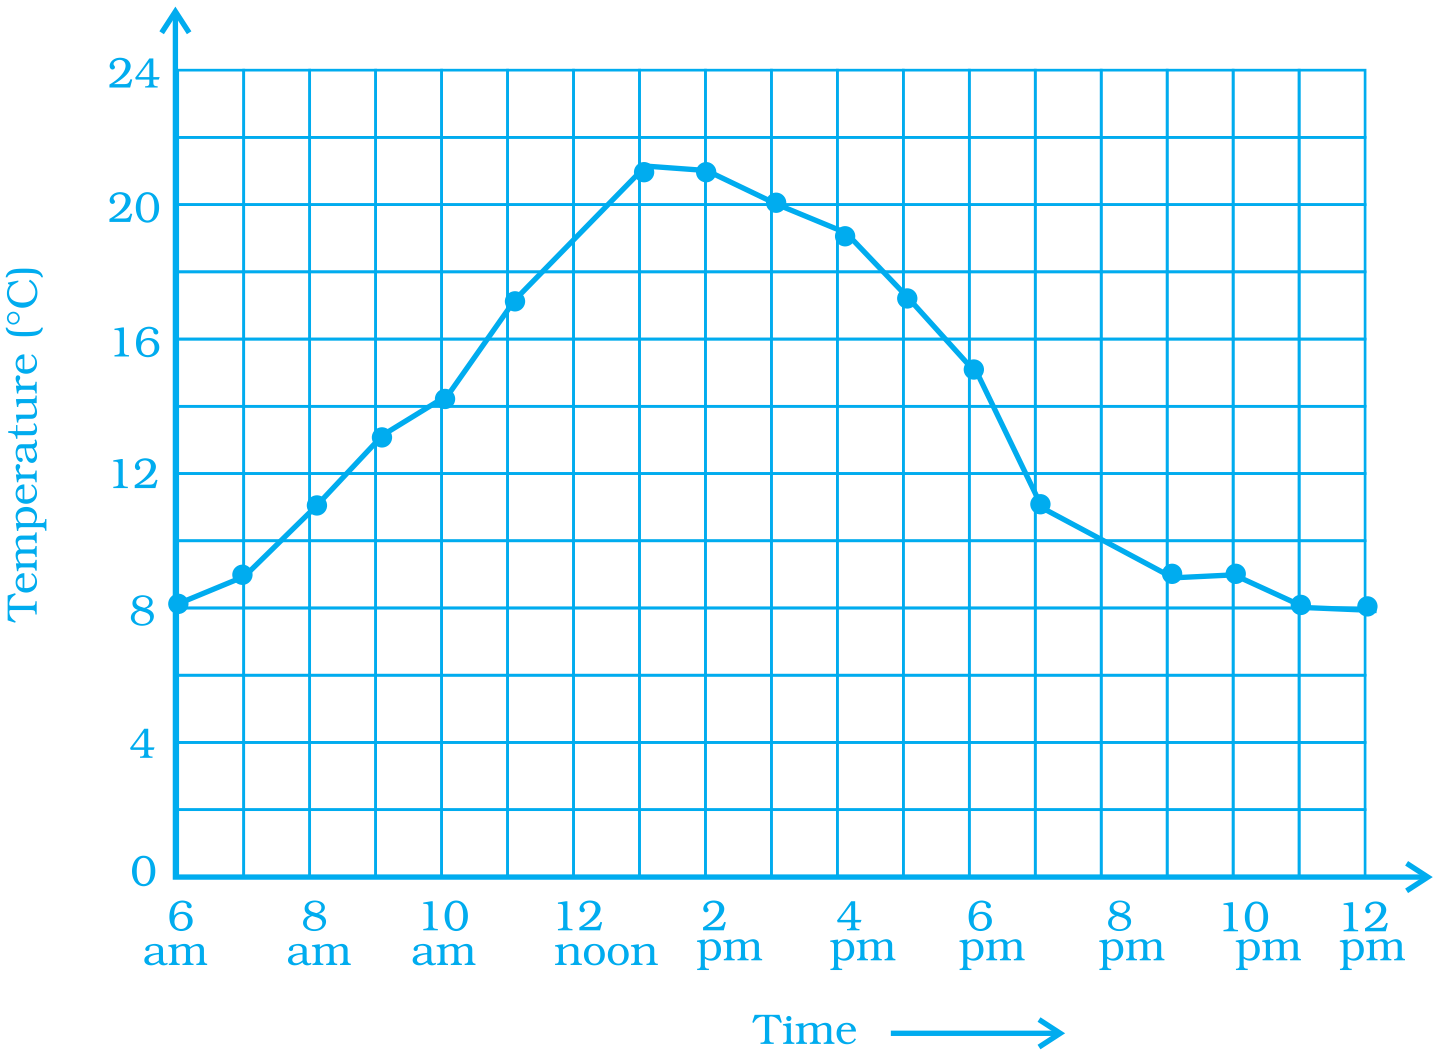
$a.$ Why does it make sense to connect the points in this situation?
$b.$ Describe the overall trend, or pattern, in the way the temperature changes over the time period shown on the graph.
$c.$ Estimate the temperature at noon and $8 \ pm.$ Answer$a.$ By connecting the points, it is easier to understand a change in the temperature.
$b.$ Initially the temperature was $8^{\circ} C$ at $6 \ \text{AM}$ and started increasing strictly till $1 \ \text{PM}$ and after that it decreased to $8^{\circ} C$ till $12 \ \text{PM} ;$
$c.$ At $12\ \text{PM}\ 19^{\circ}$ Can $d$ at $8\ \text{PM}\ 10^{\circ} C$.
View full question & answer→Question 43 Marks
Plot the given points on a graph sheet and check if the points lie on a straight line. If not, name the shape they form when joined in the given order. $(1, 2), (2, 4), (3, 6), (4, 8)$
Answer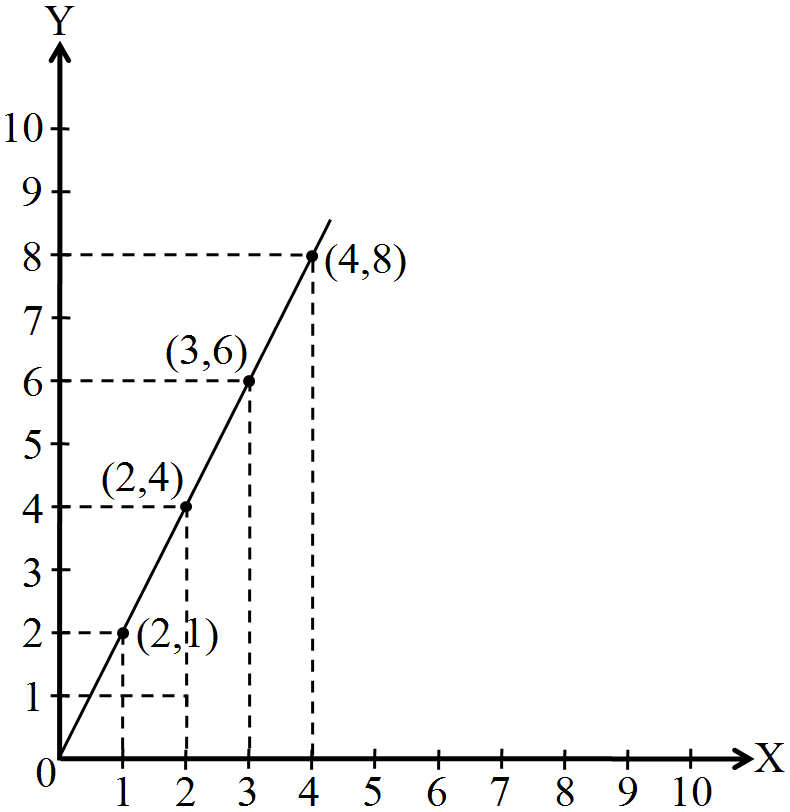
Yes, the given points lie on a atraight line.
View full question & answer→Question 53 Marks
Locate the points $A(1, 2), B (3, 4)$ and $C (5, 2)$ on a graph sheet taking suitable axes. Write the coordinates of the fourth point $D$ to complete the rhombus $ABCD.$ Measure the diagonals of this rhombus and find whether they are equal or not.
AnswerGiven points are $A (1, 2), B (3, 4)$ and $C (5, 2)$. location of given points on the graph given below.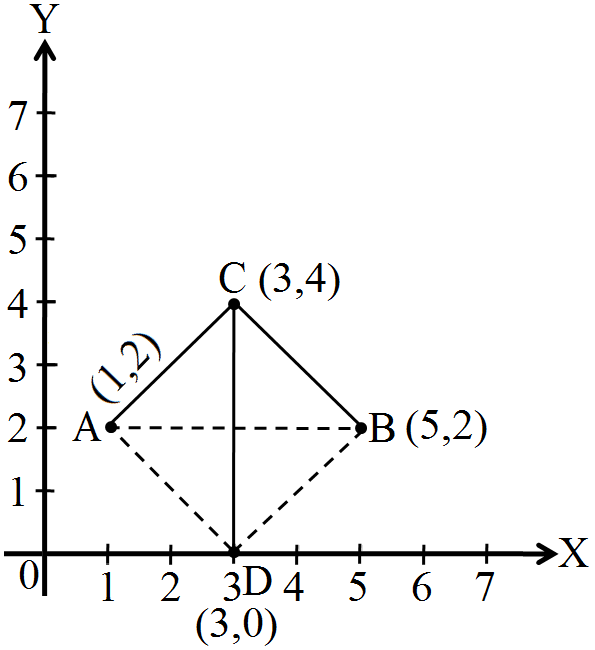
To complete the rhombus the fourth point will be $(3, 0)$.
$\therefore\ $The length of the diagonals, $AC = BD = 4$ units and they are equal. View full question & answer→Question 63 Marks
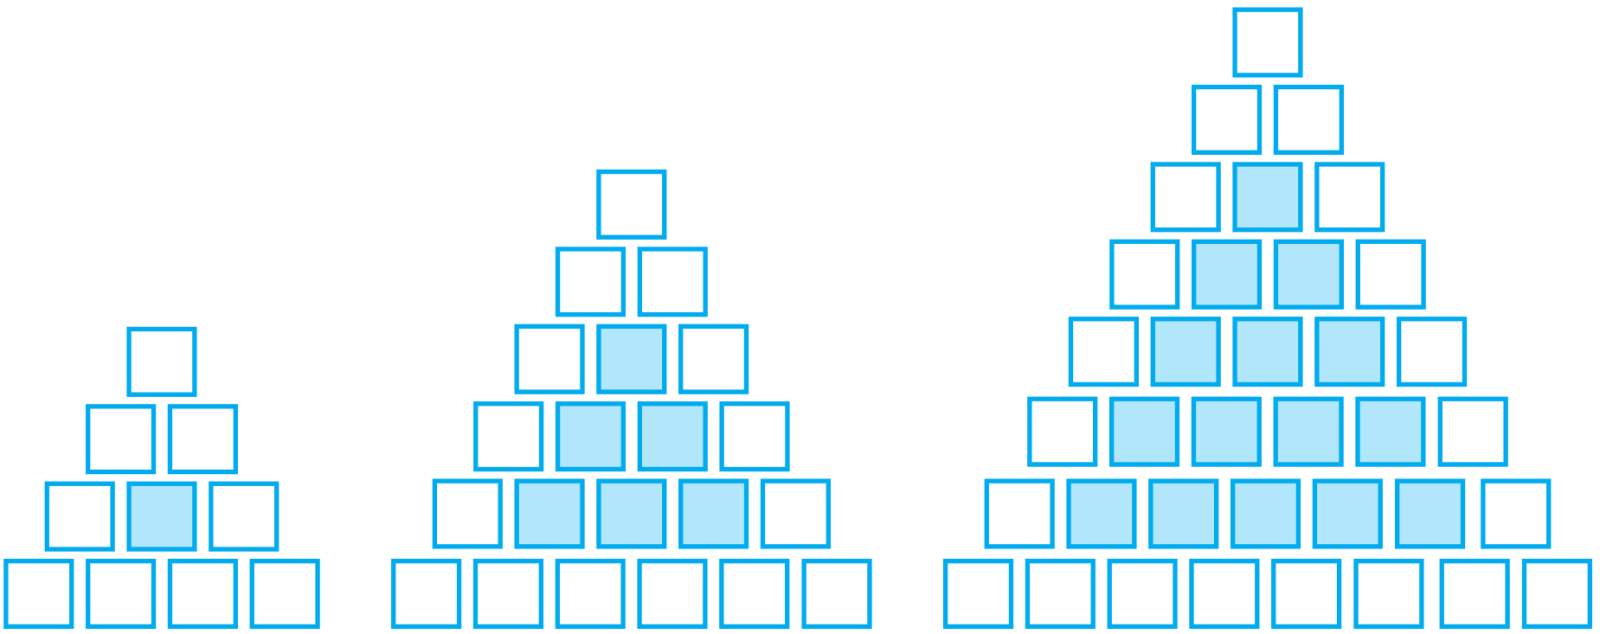
Sonal and Anmol then made another sequence of the designs. Three of the designs are shown below.
Compiete the table.
|
Rows, $r$
|
$4$
|
$6$
|
$8$
|
|
Number of white Tiles, $w$
|
$9$
|
|
|
|
Number of Purple Tiles, $p$
|
$1$
|
|
|
AnswerThe complete table is shown below
|
Rows,$r$
|
$4$
|
$6$
|
$8$
|
|
number of whlte tlles,$w$
|
$9$
|
$15$
|
$21$
|
|
number of purple tlles,$p$
|
$1$
|
$6$
|
$15$
|
View full question & answer→Question 73 Marks
Write the $x-$coordinate $($abscissa$)$ of each of the given points.
$1. (7, 3) $
$2. (5, 7)$
$3. (0, 5)$
Answer$a.$ The $x-$coordinate of the point $(7, 3)$ is $7.$
$b.$ The $x-$coordinate of the point $(5, 7)$ is $5.$
$c.$ The $x-$ooordinate of the point $(0, 5)$ is $0.$
View full question & answer→Question 83 Marks
The following table gives the growth chart of a child.
|
Helght $($in $cm)$
|
$75$
|
$90$
|
$110$
|
$120$
|
$130$
|
|
Age $($in years$)$
|
$2$
|
$4$
|
$6$
|
$8$
|
$10$
|
Draw a line graph for the table and answer the questions that follow.
$a.$ What is the height at the age of $5$ years?
$b.$ How much taller was the child at the age of $10$ than at the age of $6?$
$c.$ Between which two consecutive periods did the child grow more faster? View full question & answer→Question 93 Marks
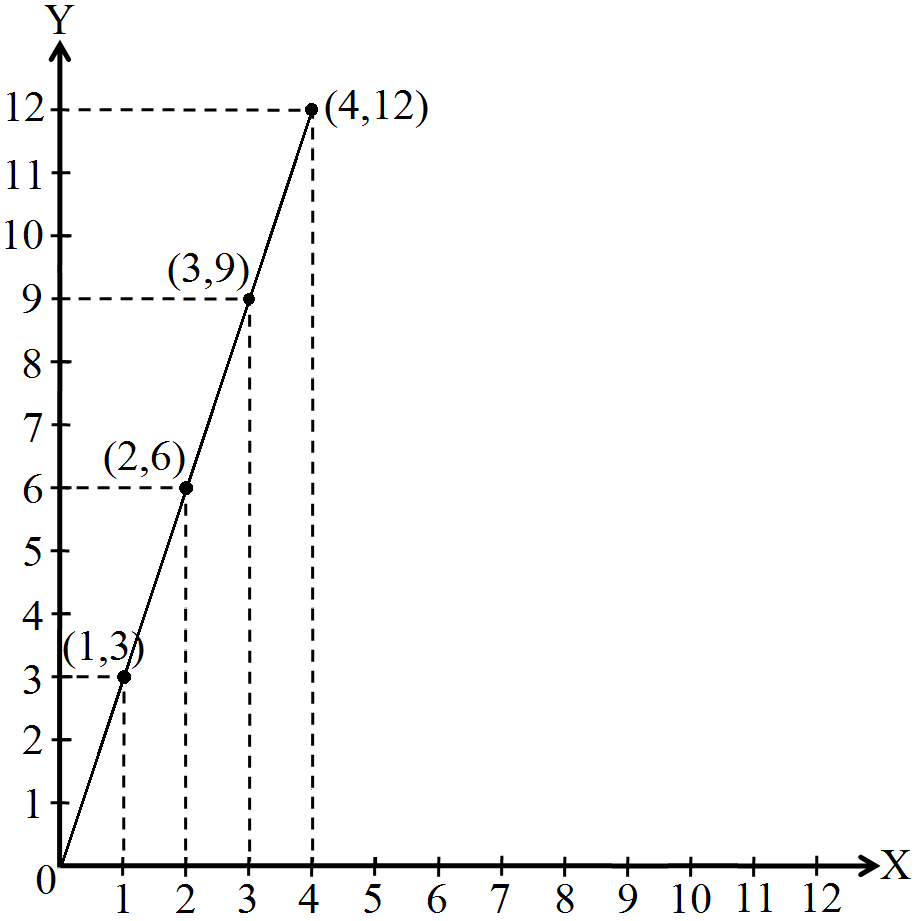
If $y–$coordinate is $3$ times $x -$coordinate, form a table for it and draw a graph.
AnswerSince, the ordinate is 3 times the abscissa, we get the following values.
|
$x$
|
$1$
|
$2$
|
$3$
|
$4$
|
|
$y$
|
$3$
|
$6$
|
$9$
|
$12$
|
View full question & answer→Question 103 Marks
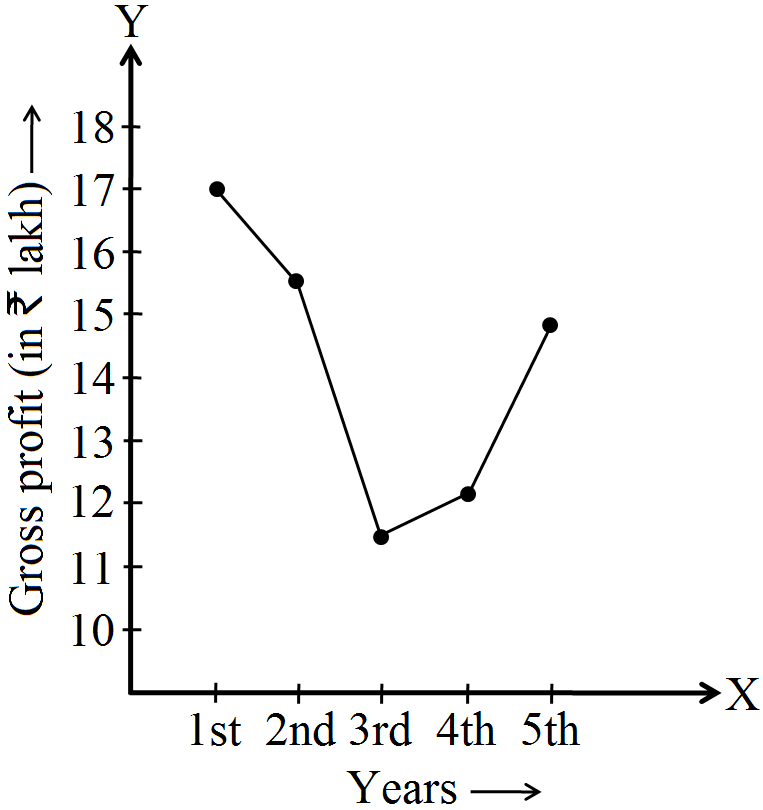
Draw the line graph using suitable scale to show the annual gross profit of a company for a period of five years.
|
Years
|
$1$st
|
$2$nd
|
$3$rd
|
$4$th
|
$5$th
|
|
Gross profit (in ₹)
|
$1700000$
|
$1550000$
|
$1140000$
|
$1210000$
|
$1490000$
|
AnswerWe have taken years on $X-$axis and gross profit on $Y-$axis. The line graph of an annual gross profit of a company for a period of five years are given below.
View full question & answer→Question 113 Marks
Write the $y-$coordinate $($ordinate$)$ of each of the given points.
$1. (3, 5)$
$2. (4, 0)$
$3. (2, 7)$
Answer$a.$ The $y-$coordinate of the point $(3, 5)$ is $5.$
$b.\ y-$coordinate of the point $(4, 0)$ is $0.$
$c.$ The ycoordinate of the point $(2, 7)$ is $7.$
View full question & answer→Question 123 Marks
Observe the given graph carefully and complete the table given below.
|
$x$
|
$1$
|
$2$
|
$3$
|
$4$
|
$5$
|
|
$y$
|
|
|
|
|
|
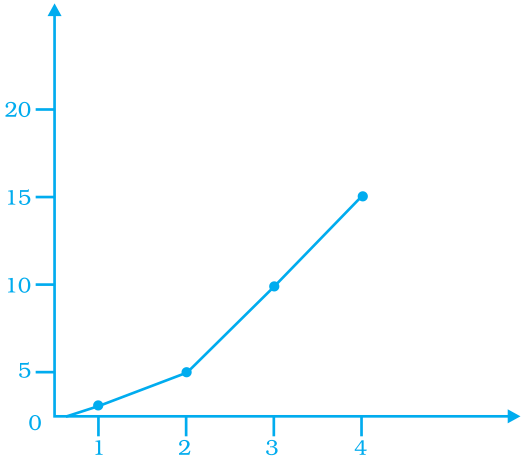
AnswerWatching the graph carefully, we see that at $x = 1, y = 1.5 x = 2, y = 5 x = 3, y = 10 x = 4, y = 15 x = 5, y = 20$
$\therefore\ $We have the following table,
|
$x$
|
$1$
|
$2$
|
$3$
|
$4$
|
$5$
|
|
$y$
|
$1.5$
|
$5$
|
$10$
|
$15$ |
$20$ |
View full question & answer→Question 133 Marks
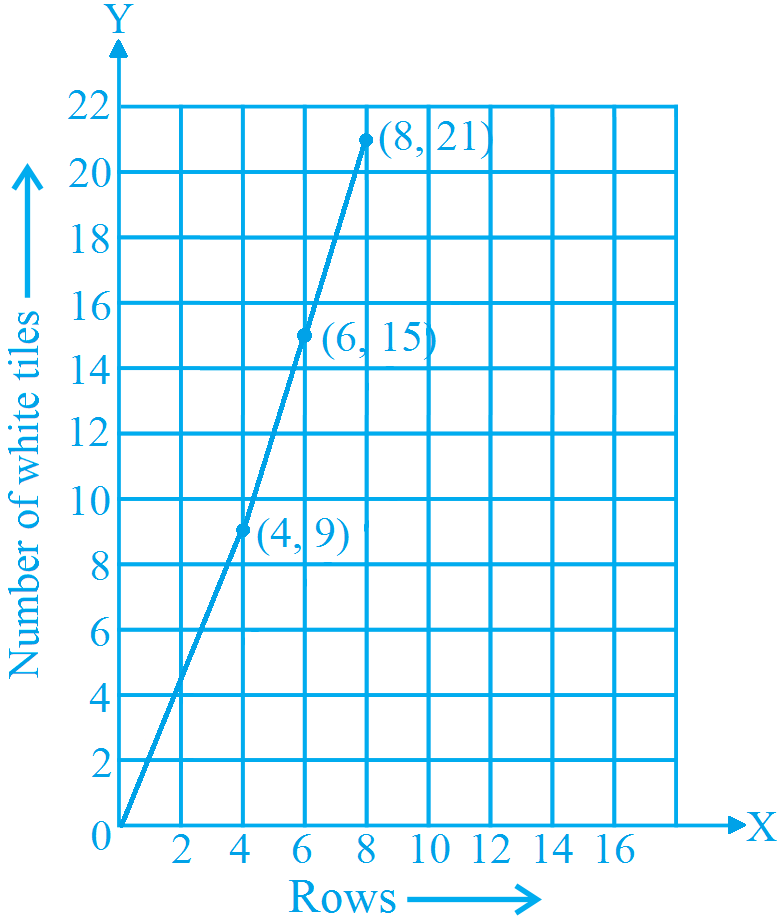
Sonal and Anmol then made another sequence of the designs. Three of the designs are shown below.

Draw a graph of rows and number of white tiles. Draw another graph of the number of rows and the number of purple tiles. Put the number of rows on the horizontal axis.
AnswerGraph between rows and number of white tilles is shown below
Graph between rose and number of purble tiles is shown below
View full question & answer→Question 143 Marks
Locate the points $A (1, 2), B (4, 2)$ and $C (1, 4)$ on a graph sheet taking suitable axes. Write the coordinates of the fourth point $D$ to complete the rectangle $ABCD.$
AnswerGiven, points are $A (1, 2), B (4, 2)$ and $C (1, 4).$ Location of given points on the graph given below.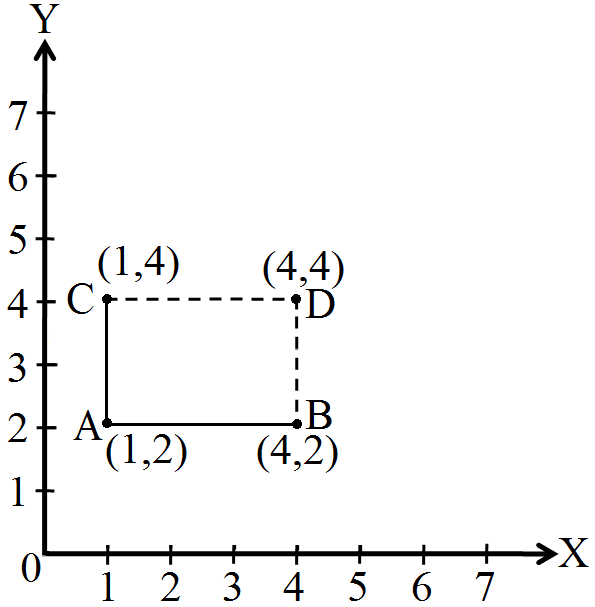
To complete the rectangle $ABCD$, the coordinates of the fourth point $D$ will be $(4, 4)$, i,e. $D (4, 4)$ View full question & answer→Question 153 Marks
Explain the situations represented by the following distance$-$time graphs.
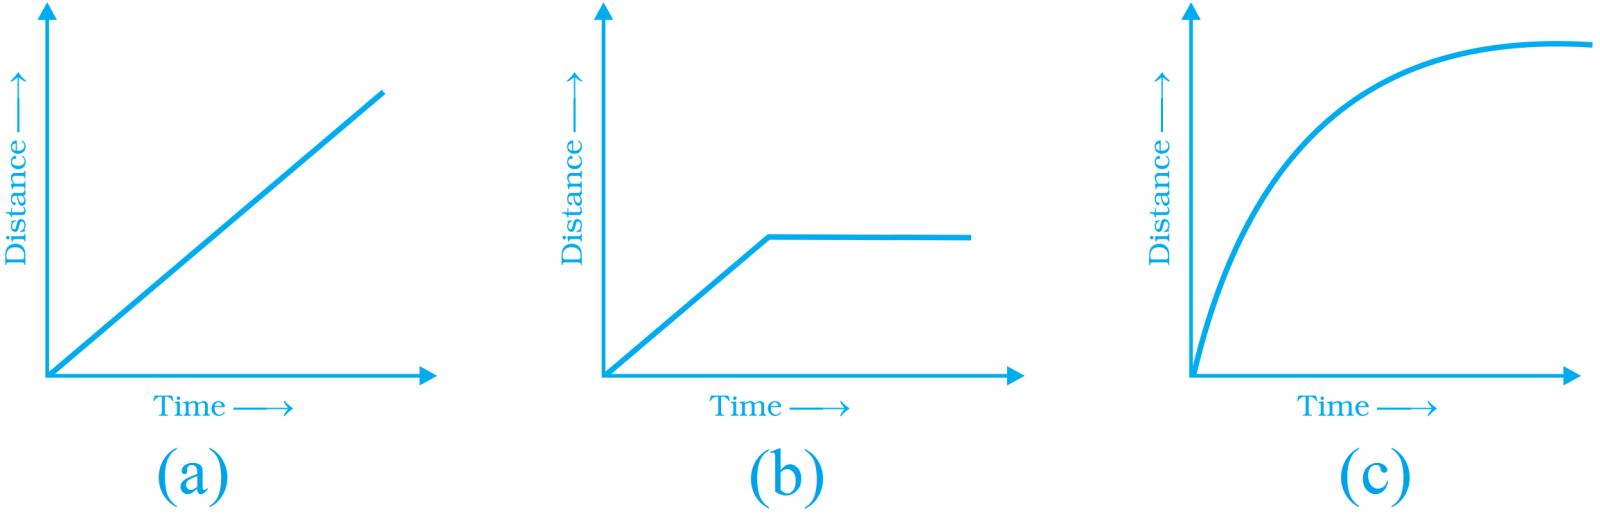
AnswerHere $X-$axis represents time and $y–$axis represents distance.
$a.$ In the first graph, we observe that when time changes, distance also varies at the same rate.
When we move along time axis away from the origin, then the graph is strictly increasing.
Hence, the object is moving at a uniform speed.
$b.$ In the graph $(b)$, we observe that initially graph increases steadily i.e. at uniform speed and after a certain period of time, it comes to rest position i.e. constant.
$c.$ In the graph $(c)$, we see that the graph increases strictly with non$-$uniform speed and then slowly comes to the rest position.
View full question & answer→Question 163 Marks
Consider this input/output table.
|
input
|
$1$
|
$2$
|
$4$
|
$5$
|
$7$
|
|
output
|
$2$
|
$5$
|
$11$
|
$14$
|
$20$
|
$a.$ Graph the values from the table by taking Input along horizontal axis from $0$ to $8$ and Output along vertical axis from $0$ to $24.$
$b.$ Use your graph to predict the outputs for inputs of $3$ and $8.$ Answer$a.$ On the basis of given input/output table, we can draw the following table.
The graph shows $y = 3x - 1$ pattern.
$b.\ \therefore\ $pattern is $y = 3x - 1$
If $x = 3$, then $y= 3 \times 3 - 1 = 9 - 1 = 8$
If $x = 8$, then $y = 3 \times 8 - 1 =24 - 1 = 23$
View full question & answer→Question 173 Marks
Plot the given points on a graph sheet and check if the points lie on a straight line. If not, name the shape they form when joined in the given order. $(4, 2), (2, 4), (3, 3), (5, 4)$
Answer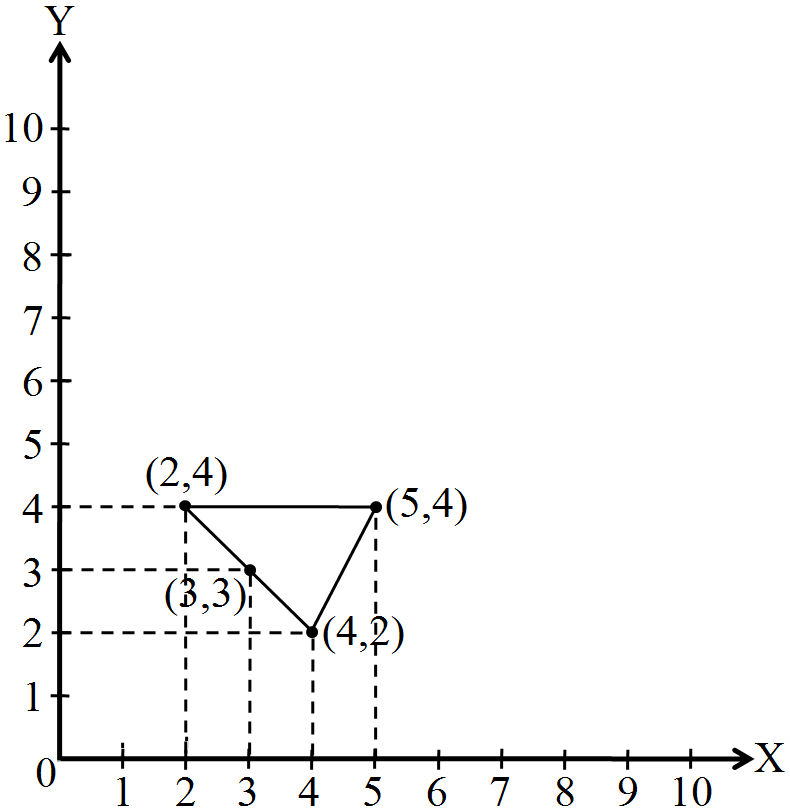
No, the points do not form a straight line, they form a triangle.
Yes, the given points lie on a straight line.
No, the points do not form a straight line, they form a square.
View full question & answer→Question 183 Marks
Plot the given points on a graph sheet and check if the points lie on a straight line. If not, name the shape they form when joined in the given order.
$(14), (1, 2), (2, 1), (2, 2)$
Answer
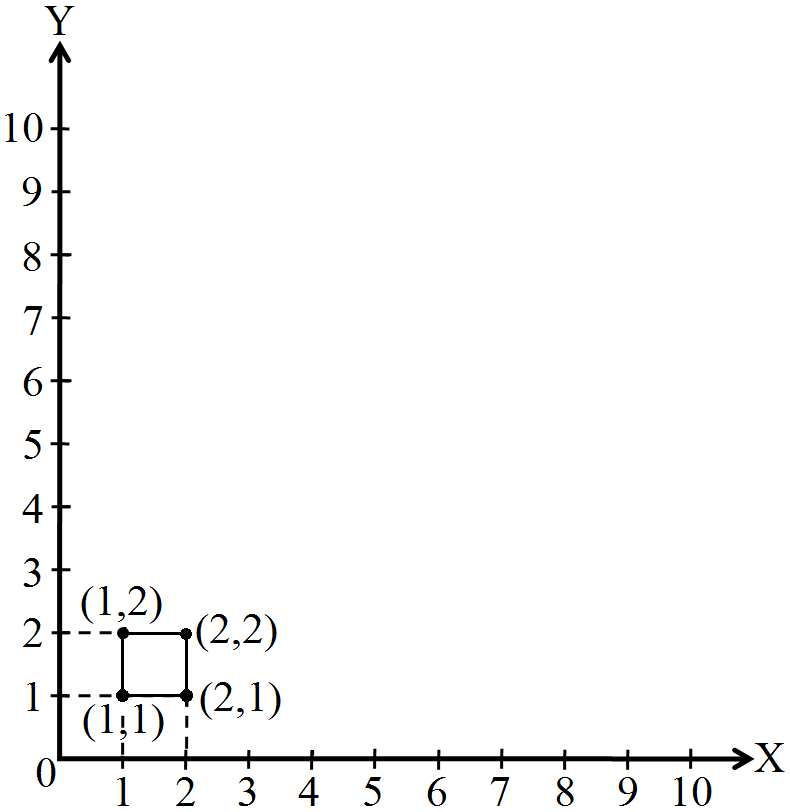
No, the points do not form a straight line, they form a square.
View full question & answer→Question 193 Marks
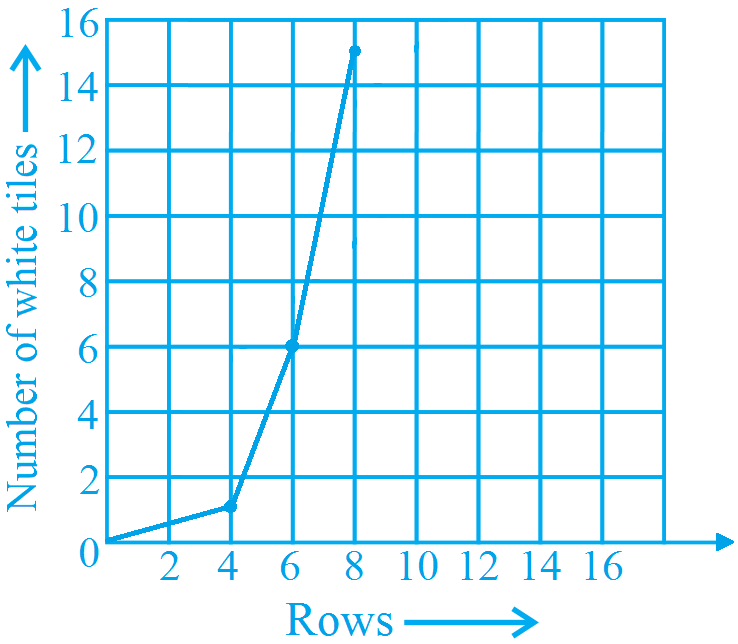
Sonal and Anmol then made another sequence of the designs. Three of the designs are shown below.
Which graph is linear?
Question 203 Marks
This graph shows the per cent of students who dropped out of school after completing High School. The point labelled $A$ shows that, in $1996$, about $4.7\%$ of students dropped out.
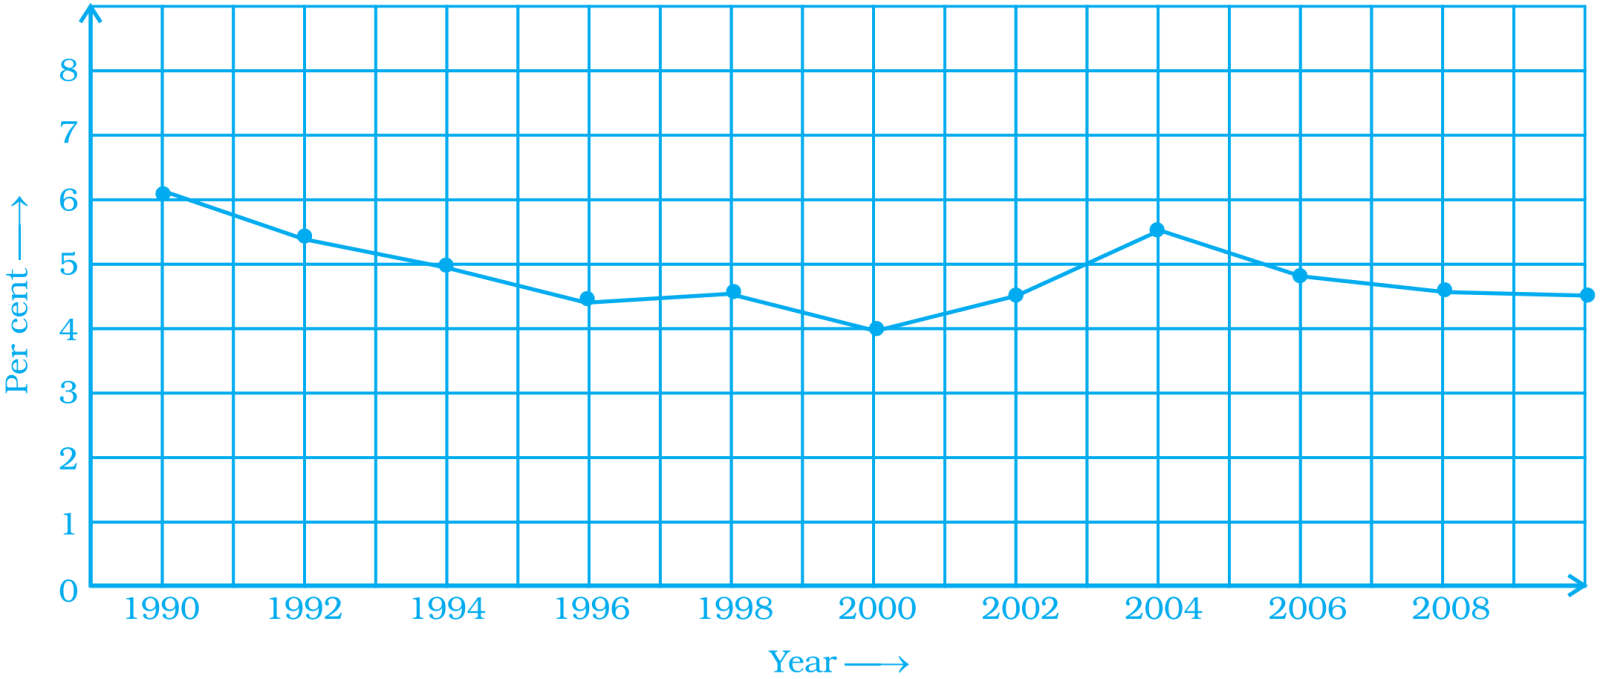
$a.$ In which year was the dropout the rate highest? In which year was it the lowest?
$b.$ When did the per cent of students who dropped out of high school first fall below $5\%?$
$c.$ About what per cent of students dropped out of high school in $2007?$ About what per cent of students stayed in high school in $2008?$ AnswerObserving the graph carefully, we have
$a.$ The drop out rate was the highest in the year $1990$ and the least in $2000.$
$b.$ In the year $1996$, the per cent of students dropped out of high school first fall below $5\%.$
$c.$ About $4.7\%$ students dropped out of high school in $2007.$
View full question & answer→Question 213 Marks
The following is the time$-$distance graph of Sneha’s walking.
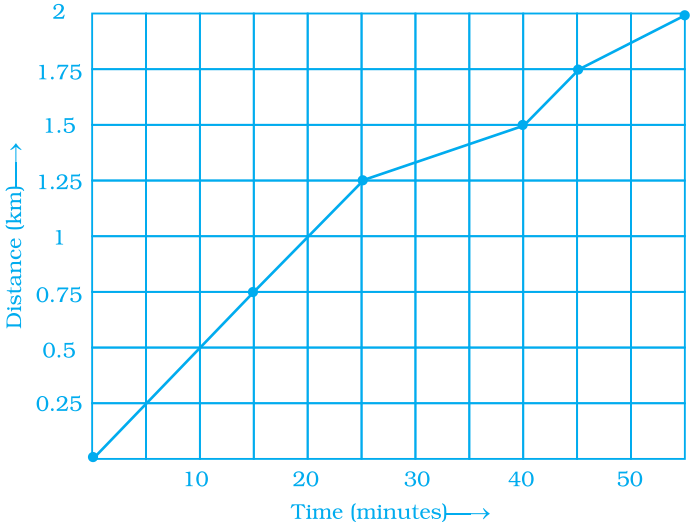
$a.$ When does Sneha make the least progress? Explain your reasoning.
$b.$ Find her average speed in $\text{km/hour.}$ Answer$a.$ Sneha made least progress between $25$ min to $40$ min.
Observing the graph carefully, we see that initially, she is travelling approximately $0.5\ km$ in $10$ min $0.25\ km$ in $5$ min, till the first $25$ min. But after $25$ min, her speed decreased as she travelled $0 25\ km$ in $5$ min in $15$ min $($between $25$ min to $40$ min$).$
$b. \text{Average apeed}=\frac{\text{Total distance travelied}}{\text{Time}}$
$=\frac{2}{\frac{55}{60}}$
$=\frac{2}{55}\times60$
$=2.18\text{km/h}$
View full question & answer→Question 223 Marks
Plot the given points on a graph sheet.
$1. (5, 4)$
$2. (2, 0)$
$3. (3, 1)$
$4. (0, 4)$
$5. (4, 5)$
View full question & answer→Question 233 Marks
Locate the points $P(3, 4), Q(1, 0), R(0, 4), S(4, 1)$ on a graph sheet and write the coordinates of the point of intersection of line segments $PQ$ and $RS$
Observing the graph, we see that the line segments $PQ$ and $RS$ intersect at the point.
Answer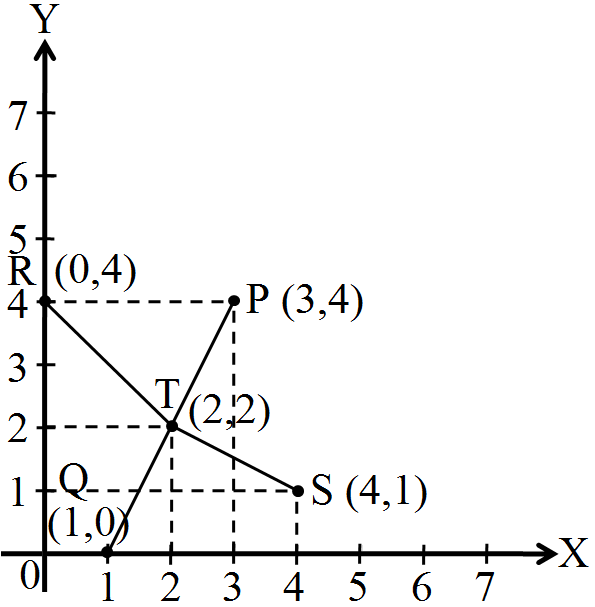
Observing the graph, we see that the line sagments $PQ$ and $RS$ intersect at the point $(2, 2). View full question & answer→Question 243 Marks
The table shows the data collected for Dhruv’s walking on a road.
|
time $($in minutes$)$
|
$0$
|
$5$
|
$10$
|
$15$
|
$20$
|
$25$
|
|
Distsnce $($in $km)$
|
$0$
|
$0.5$
|
$1$
|
$1.25$
|
$1.5$
|
$1.75$
|
$a.$ Plot a line graph for the given data using a suitable scale.
$b.$ In what time periods did Dhruv make the most progress? Answer$a.$
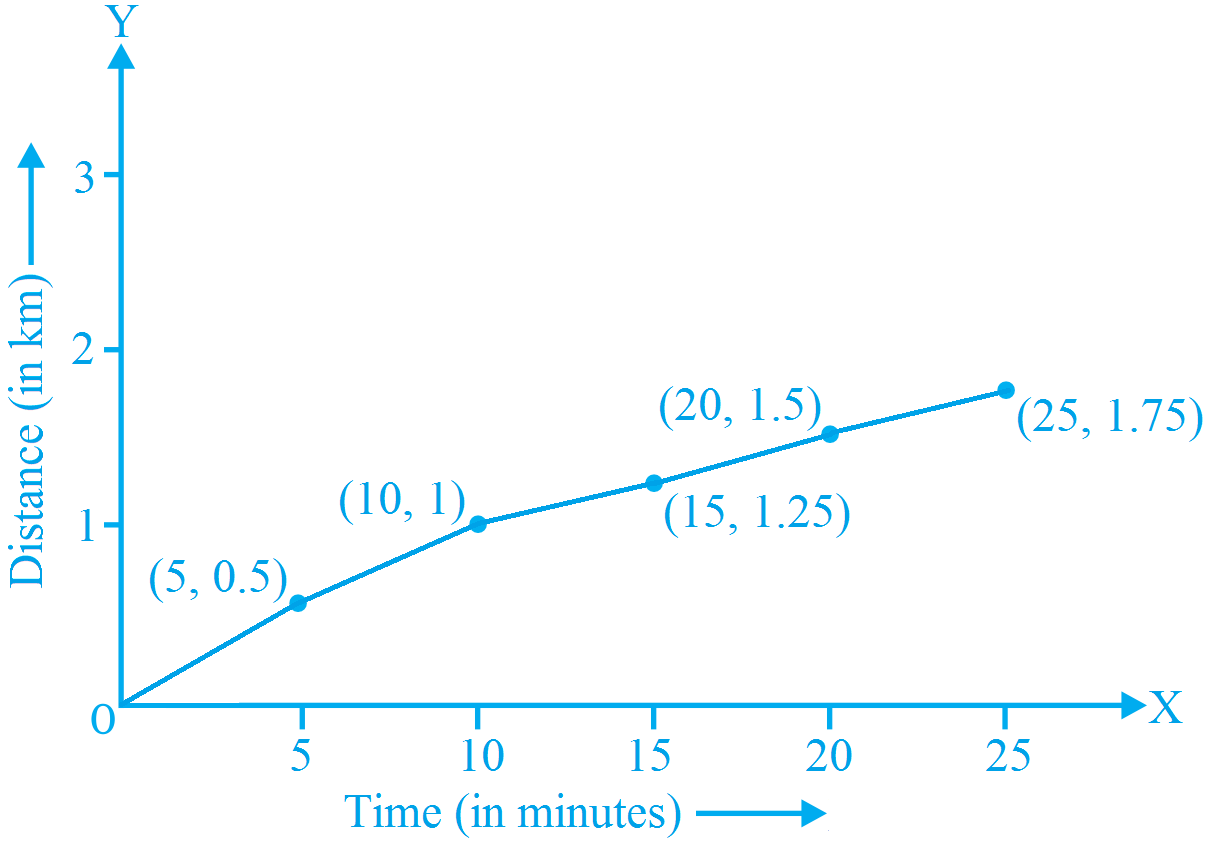
$b.$ Dhruv made most progress from $0$ to $5$ min and from $5$ to $10$ min. View full question & answer→Question 253 Marks
Study the given graphs $(a)$ and $(b)$ and complete the corresponding tables below.
$a.$
$b.$
|
$x$
|
$0$
|
$1$
|
$2$
|
$3$
|
$4$
|
|
$y$
|
|
|
|
|
|
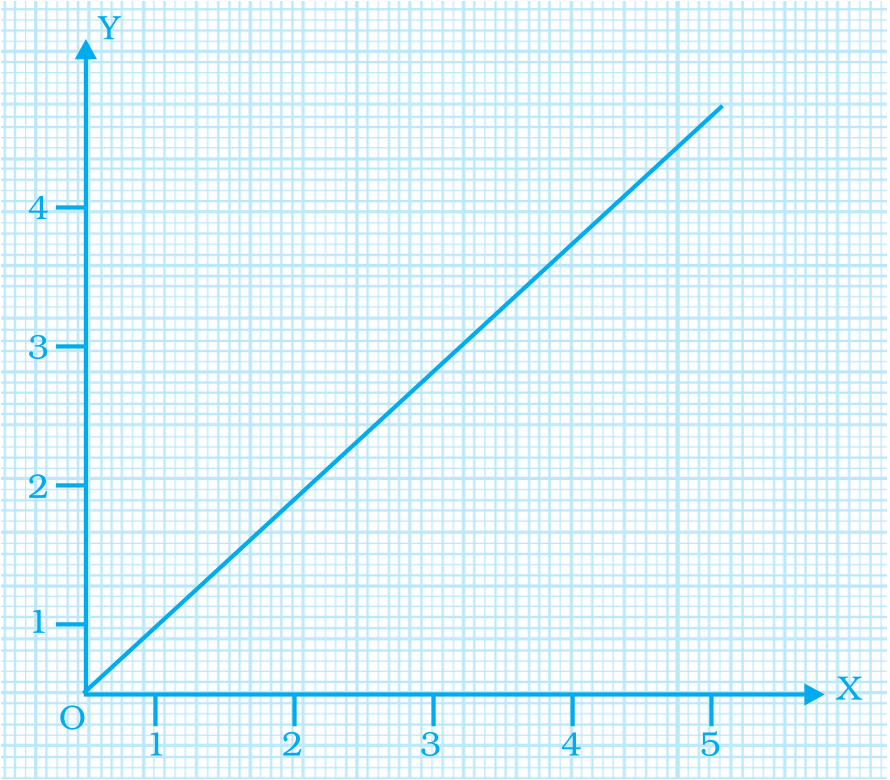
Answer$a.$Observing the graph $(a)$, we conclude that at
$x = 0, y = 0$
$x = 1, y = 1$
$x = 2, y = 2$
$x = 3, y = 3$
|
$x$
|
$0$
|
$1$
|
$2$
|
$3$
|
|
$y$
|
$0$
|
$1$
|
$2$
|
$3$
|
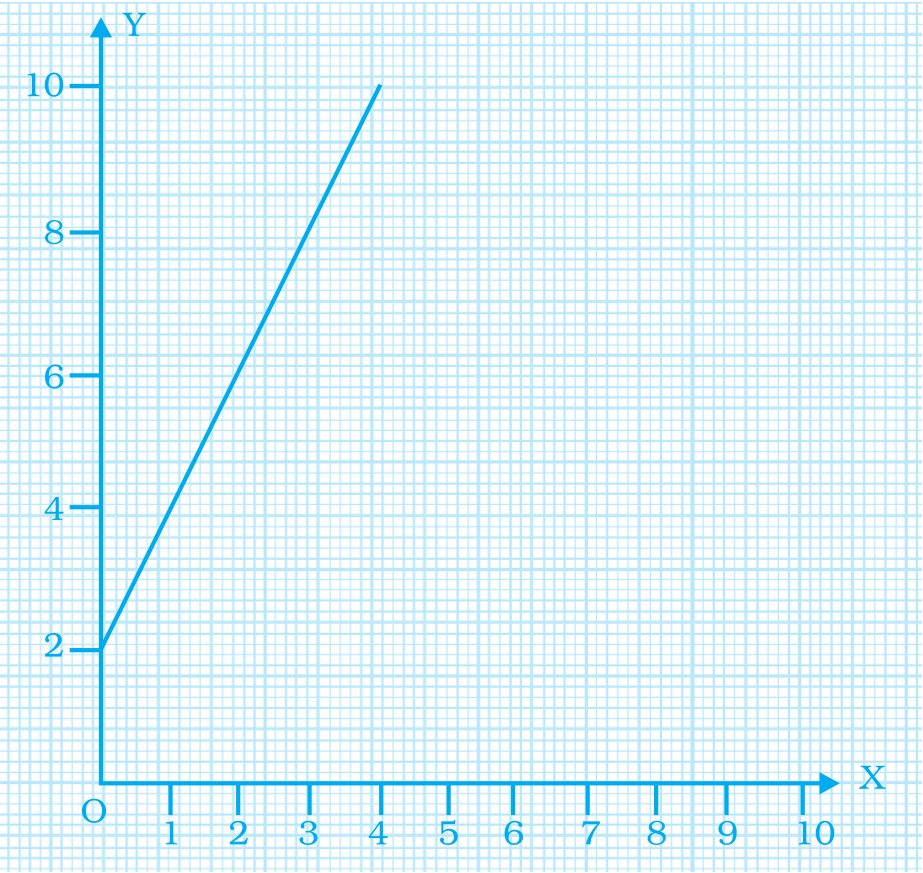
$b.$Observing the graph $(b)$, we conclude that at
$x = 0, y = 2$
$x = 1, y = 4$
$x = 2, y = 6$
$x = 3, y = 8$
$x = 4, y = 10$
|
$x$
|
$0$
|
$1$
|
$2$
|
$3$
|
$4$
|
|
$y$
|
$2$
|
$4$ |
$6$ |
$8$ |
$10$ |
View full question & answer→Question 263 Marks
Make a line graph for the area of a square as per the given table.
|
Side (in cm)
|
$1$
|
$2$
|
$3$
|
$4$
|
|
Area (in $cm^2$)
|
$1$
|
$4$
|
$9$
|
$16$
|
Is it a linear graph? Answer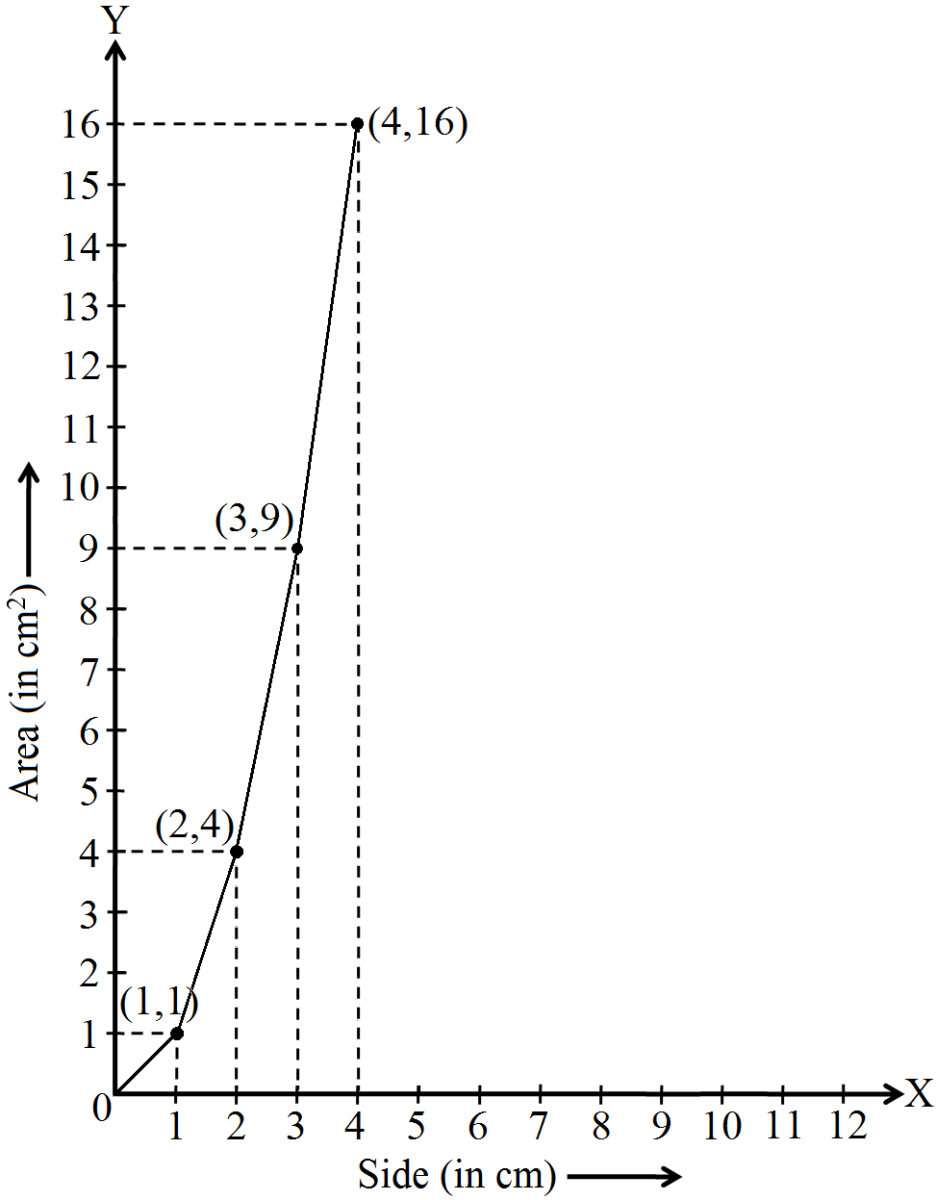
Yes, Is it a linear graph.
View full question & answer→Question 273 Marks
Study the graph and answer the questions that follow.
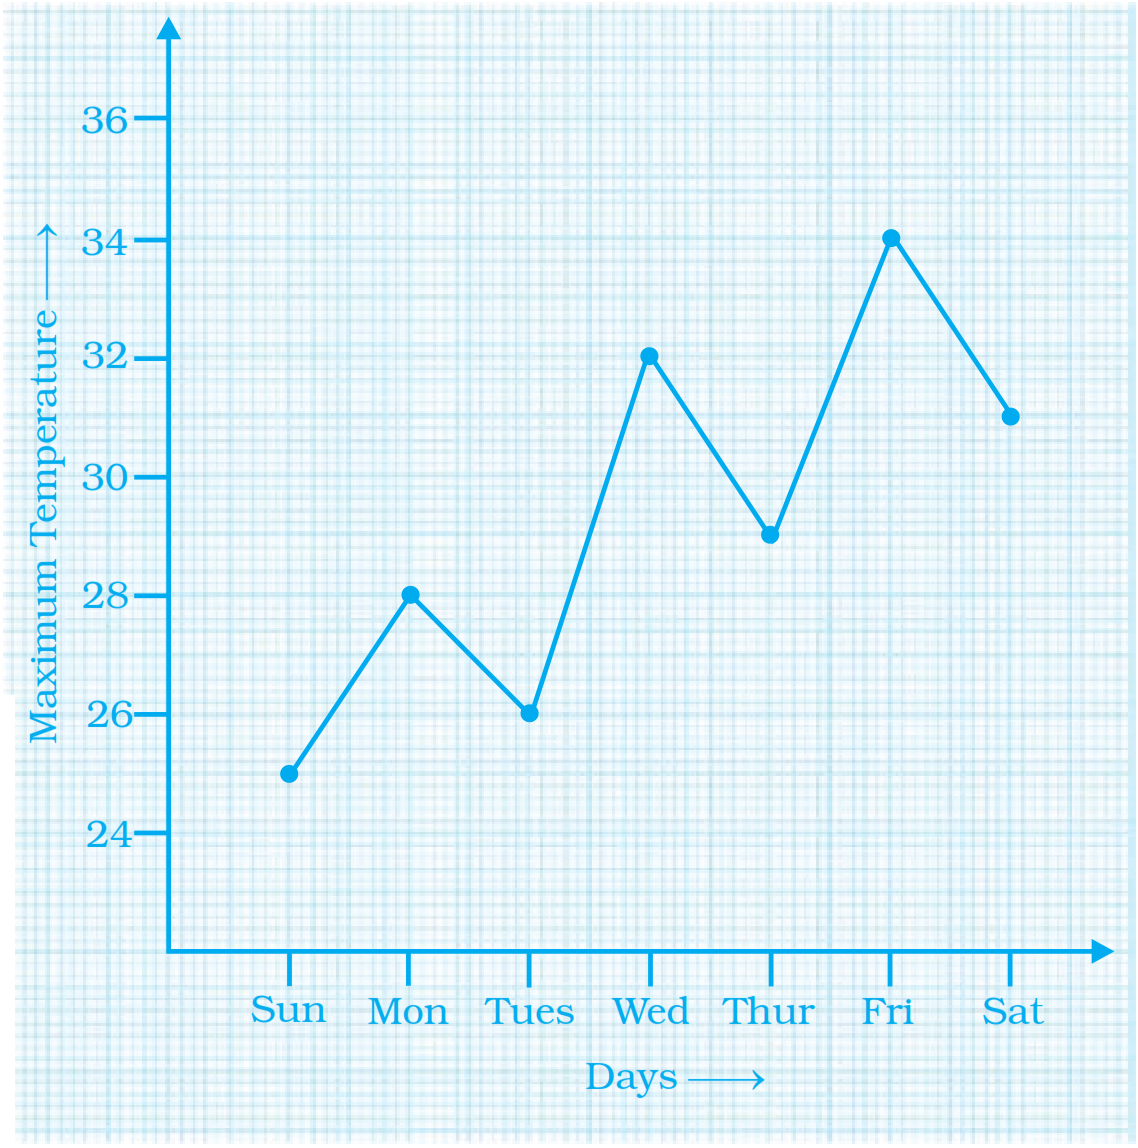
$a.$ What information does the graph give?
$b.$ On which day was the temperature the least?
$c.$ On which day was the temperature $31^\circ C?$
$d.$ Which was the hottest day? Answer$a.$ The information obtained from the given graph is that the maximum temperature is $34^{\circ} C$ and minimum temperature is $25^{\circ} C$ in a week.
$b.$ On Sunday, the temperature was $25^{\circ} C$.
So, it is least temperature in the week.
$c.$ On Saturday, the temperature was $31^{\circ} C$.
$d.$ On Friday, the temperature was maximum i.e. $34^{\circ} C$.
Hence, it is the hottest day of the week.
View full question & answer→Question 283 Marks
Study the given map of a zoo and answer the following questions.
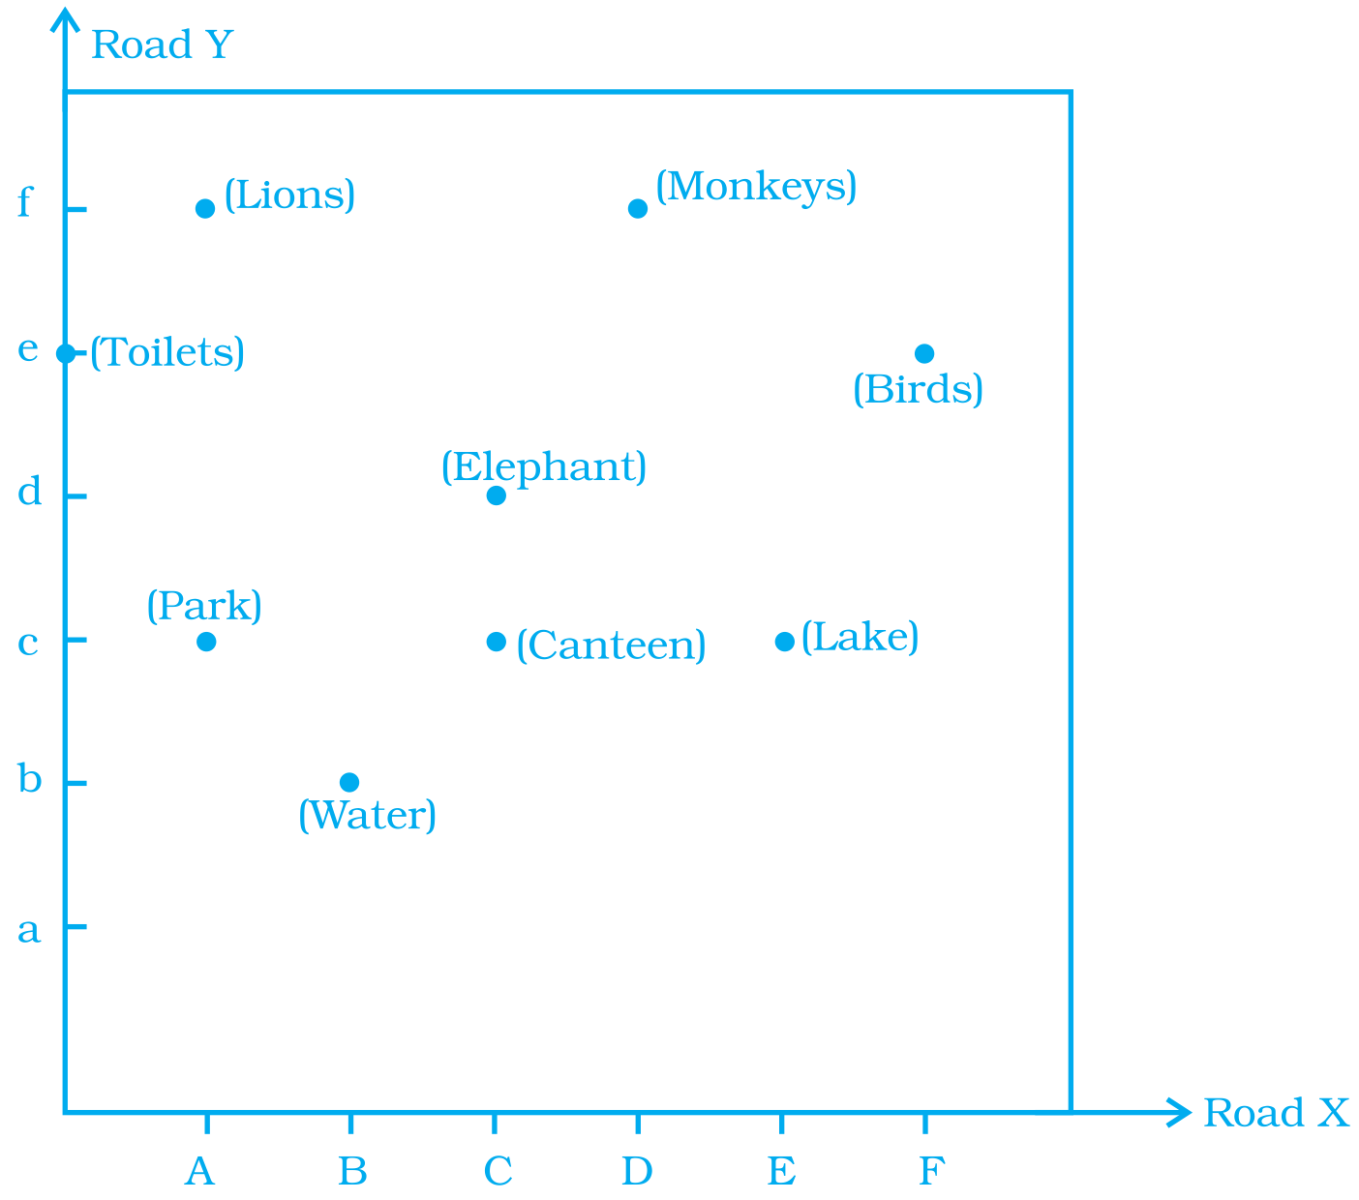
$a.$ Give the location of lions in the zoo.
$b. (D, f)$ and $(C, d)$ represent locations of which animalsin the zoo?
$c.$ Where are the toilets located?
$d.$ Give the location of canteen? Answer$a.$ Lions are at a distance of $A$ units from road $Y$ and $f$ units from road $X$.
$\therefore$ The location of lions is represented by the point $(Af)$
$b.$ Observing the map carefully, we see that $(D, f)$ denotes the location of monkeys and $(C, d)$ denotes the location of elephants.
$c.$ Toilets are located on the road $Y$ at a distance of $e$ units from the origin.
Hence, the location of toilets is $(0, e)$.
$d.$ Canteen is located at a distance of $C$ units from road $Y$ and $c$ units from road $X$.
Hence, the location of the canteen is $(C, c).$
View full question & answer→Question 293 Marks
Observe the toothpick pattern given below: 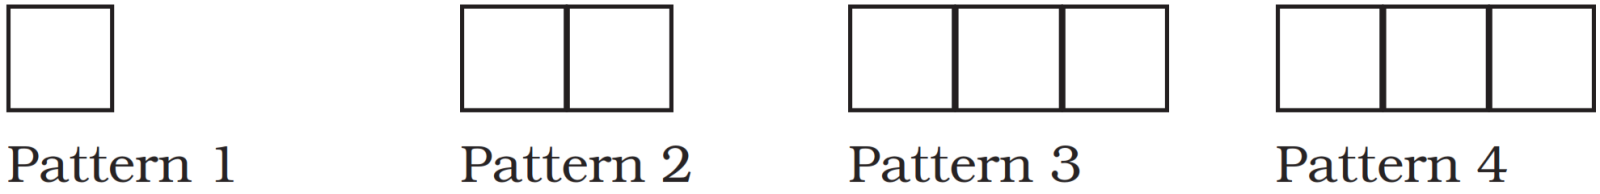
$a.$ Imagine that this pattern continues. Complete the table to show the number of toothpicks in the first six terms.
|
Pattern
|
$1$
|
$2$
|
$3$
|
$4$
|
$5$
|
$6$
|
|
Toothpicks
|
$4$
|
|
|
$15$
|
|
|
$b.$ Make a graph by taking the pattern numbers on the horizontal axis and the number of toothpicks on the vertical axis. Make the horizontal axis from $0$ to $10$ and the vertical axis from $0$ to $30.$
$c.$ Use your graph to predict the number of toothpicks in patterns $7$ and $8$. Check your answers by actually drawing them.
$d.$ Would it make sense to join the points on this graph? Explain. Answer$a.$ On the basis of given patterns, we can arrange the following table which show the number of toothpicks in the first six terms.
|
Pattern
|
$1$ |
$2$ |
$3$ |
$4$ |
$5$ |
$6$ |
|
Toothpicks
|
$4$ |
$7$ |
$10$ |
$15$ |
$16$ |
$19$ |
Pattern and toothpicks shows the following relation as
$1 \rightarrow 4, 2 \rightarrow 4 + 3 = 7$
$3 \rightarrow 7 + 3 = 10, 4 \rightarrow 10 + 3 = 13$
$5 \rightarrow 13 + 3 = 16, 6 \rightarrow 16, 3 + 19$
$b.$On the basis of given condition, we can draw the following graph
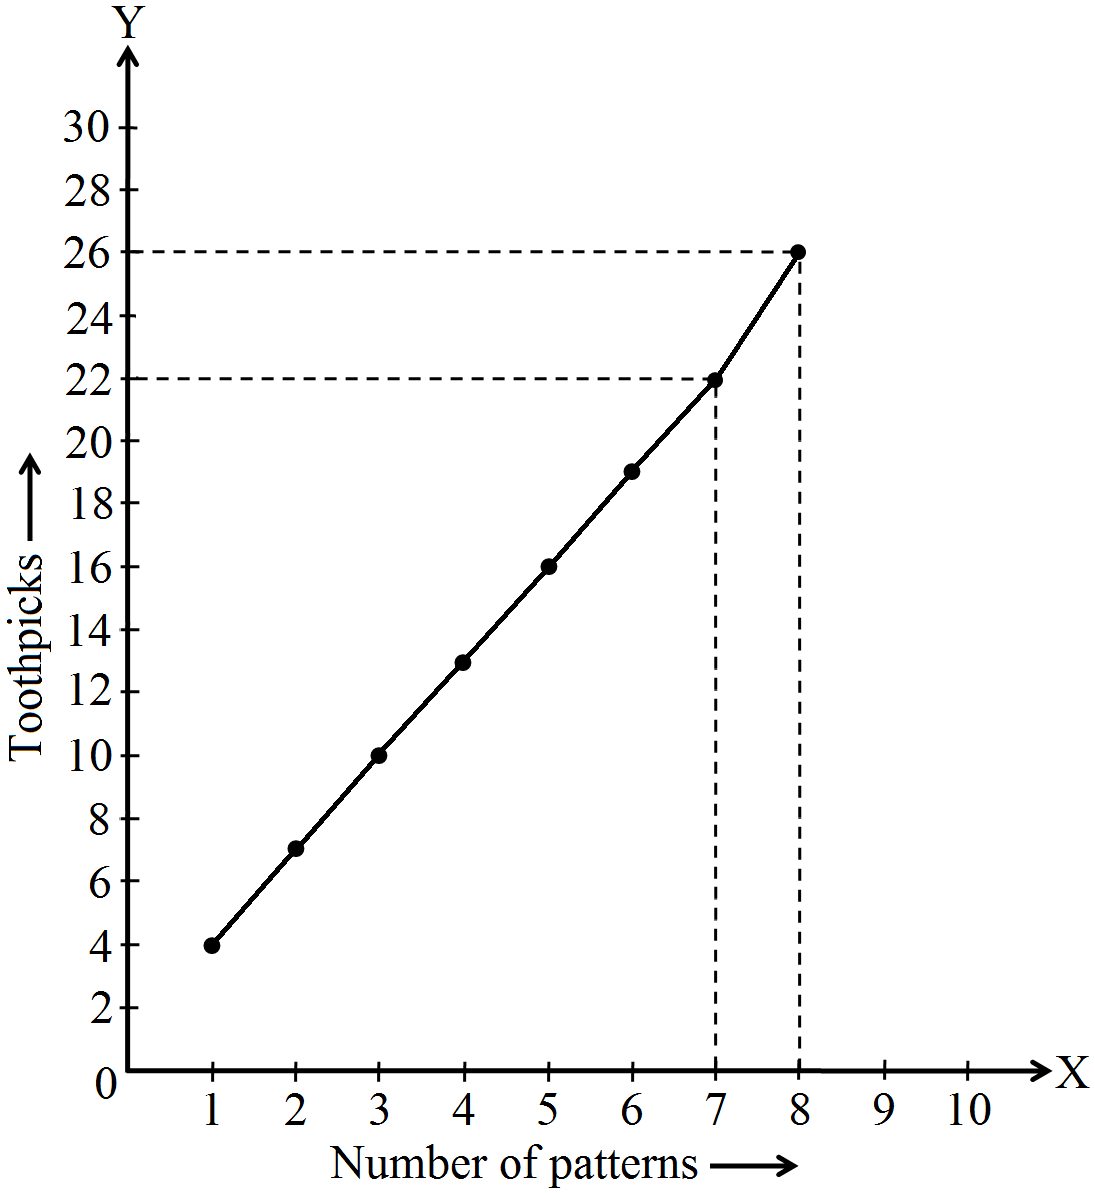
$c.$ the graph follows the $y = 3x + 1$ pattern. If $x = 7$, then $y = 3 × 7 + 1 = 21 + 1 = 22$ and if $x = 8$, then $y = 3 × 8 + 1 = 24 + 1 = 25$
| $x$ |
$7$ |
$8$ |
| $y$ |
$22$ |
$25$ |
$d.$ Yes, it shows the relation between $x$ and $y$ follows the given pattern $y = 3x + 1$ View full question & answer→Question 303 Marks
The points on the graph below represent the height and weight of the donkey, dog, crocodile, and ostrich shown in the drawing.
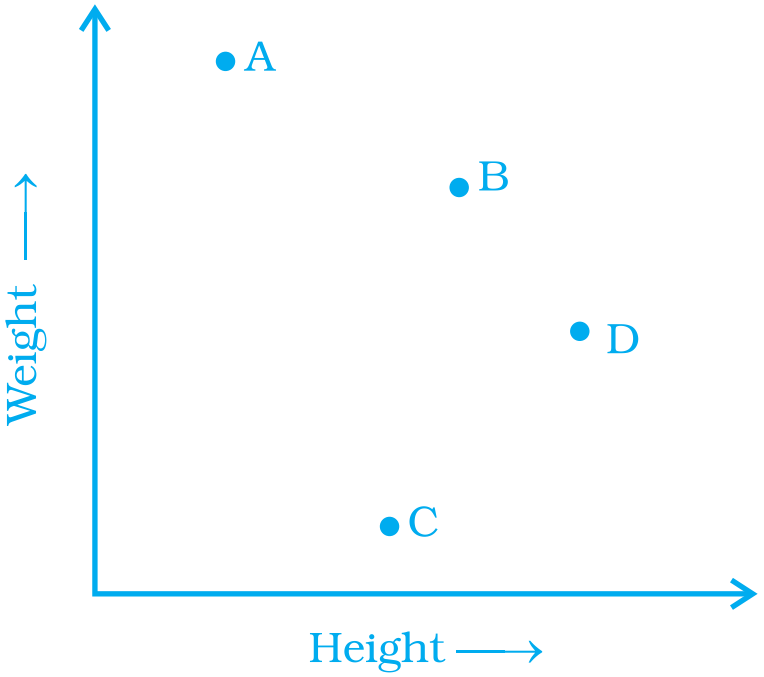
$a.$ What are the two variables represented in the graph?
$b.$ Which point represents each animals? Explain. Answer$a.$ Height and weight are the two variables in the graph.
$b.$ In the graph,we observe that the points $A$ represents a crocodile as it has least height and greatest weight among all animals.
$A-$Crocodile ‘ $[$least height, greatest weight$]$
$B –$ Donkey $[$height and weight more than dog$]$
$C –$ Dog
$D –$ Ostrich $[$greatest height$]$
View full question & answer→Question 313 Marks
Draw a graph for the radius and circumference of circle using a suitable scale. $[$ Hint: Take radius $= 7, 14, 21$ units and so on.$]$ Form the graph,
$a.$ find the circumference of the circle when radius is $42$ units.
$b.$ at what radius will the circumference of the circle be $220$ units?
AnswerIf radius is $7$ units, then circumference of the circle $=2 \times \pi \times 7$
$2 \times \frac{22}{7} \times 7=2 \times 22=44$ units $[\because$ circumference o a circle $=2 \pi]$ If radius $14$ units, then circumference
$=2 \times \pi \times 14=28 \times \frac{22}{7}=88$ units If radius $21$ units, then circumference
$=2 \times \pi \times 21=42 \times \frac{22}{7}=132$ units If radius $28$ units, then circumference
$=2 \times \pi \times 28=56 \times \frac{22}{7}=176$ units If radius $35$ units, then circumference
$=2 \times \pi \times 35=70 \times \frac{22}{7}=220$ units If radius $42$ units, then circumference
$=2 \times \pi \times 42=84 \times \frac{22}{7}=264$ units Table for the graph.
|
Radlu of the clrcle
|
$7$
|
$14$
|
$21$
|
$28$
|
$35$
|
$42$
|
|
clrcumference of the clrcle
|
$44$
|
$88$
|
$132$
|
$176$
|
$220$
|
$264$
|
graph form the above deta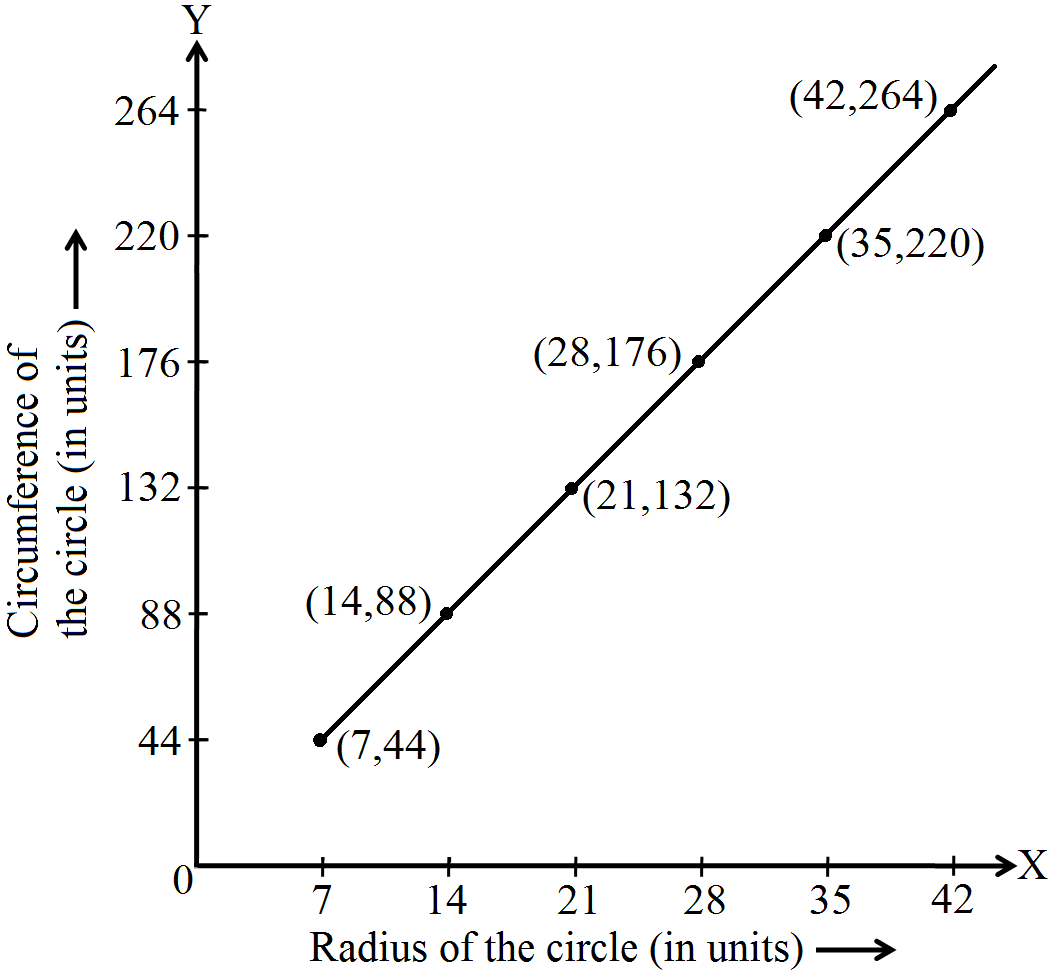
$a.$ the circumference of the circle will be $264$ units when radius is $42$ units.
$b.$ the radius of the circle will be $35$ units, When the circumference of the circe equals $220$ units. View full question & answer→