Question
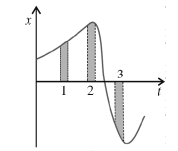
Figure gives the x – t plot of a particle in one dimensional motion. Three different equal intervals of time are shown. In which interval is the average speed greatest, and in which is it the least? Give the sign of average velocity for each interval.
Image

Answer

We know that the value of average velocity in a small time interval is equal to the slope of the graph $(x-t)$ at that time interval, hence the average speed is maximum in interval 3, because in this the slope of the graph is maximum. And the slope of $(x-t)$ graph is minimum in 2. Hence the average velocity will also be minimum in 2.
The mean velocity in intervals 1 and 2 is positive but in interval 3 it is negative. Because $x_2-x_1$ is positive in interval 1,2 and it is negative in interval 3.

Need a full question paper?

Generate a complete, print-ready paper with questions like this in minutes — across 16+ boards, with answer keys.

Start Generating Free