Find the amount of work done to increase the temperature of one mole of an ideal gas by $30^o\ C$ if it is expanding under the condition .... $J$
$V\propto {T^{\frac{2}{3}}}$ $[R = 1.99\ cal/mol-K]$
Diffcult


Download our appand get started for free
Experience the future of education. Simply download our apps or reach out to us for more information. Let's shape the future of learning together!No signup needed.*
Similar Questions
- 1The heat capacity of one mole an ideal is found to be $C_V=3 R(1+a R T) / 2$, where $a$ is a constant. The equation obeyed by this gas during a reversible adiabatic expansion isView Solution
- 2An ideal gas is expanding such that $\mathrm{PT}^2=$ constant. The coefficient of volume expansion of the gas isView Solution
- 3View SolutionThe efficiency of a Carnot engine depends upon
- 4One mole of an ideal gas goes from an initial state $A$ to final state $B$ via two processes : It first undergoes isothermal expansion from volume $V$ to $3\, V$ and then its volume is reduced from $3\, V$ to $V$ at constant pressure. The correct $P-V$ diagram representing the two processes isView Solution
- 5An ideal gas is expanding such that $\mathrm{PT}^2=$ constant. The coefficient of volume expansion of the gas isView Solution
- 6View SolutionWhen a gas expands adiabatically
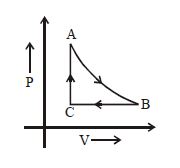
- 7The adjoining figure shows the $P-V$ diagram for a fixed mass of an ideal gas undergoing cyclic process. $AB$ represents isothermal process and $CA$ represents isochoric process.Which of the graph shown in the following figures represents the $P-T$ diagram of the cyclic process ?View Solution
- 8A gas expands adiabatically at constant pressure such that its temperature $T \propto \frac{1}{{\sqrt V }}$, the value of ${C_P}/{C_V}$ of gas isView Solution
- 9View SolutionIn isothermic process, which statement is wrong
- 10An ideal heat engine exhausting heat at ${77^o}C$ is to have a $30\%$ efficiency. It must take heat at ...... $^oC$View Solution