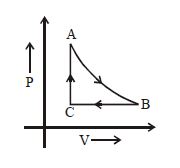
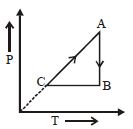
The adjoining figure shows the $P-V$ diagram for a fixed mass of an ideal gas undergoing cyclic process. $AB$ represents isothermal process and $CA$ represents isochoric process.Which of the graph shown in the following figures represents the $P-T$ diagram of the cyclic process ?

- A
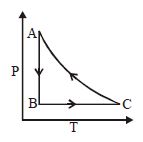
- B
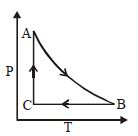
- C
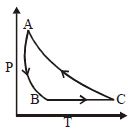
- D
Medium


Download our appand get started for free
Experience the future of education. Simply download our apps or reach out to us for more information. Let's shape the future of learning together!No signup needed.*
Similar Questions
- 1A bubble from bottom of lake rises to its surface. Its volume doubles in the process. Assuming isothermal conditions, atmospheric pressure $= 75\, cm$ of $Hg$ and ratio of densities of mercury and water $40/3$. The depth of lake will be ..... $m$View Solution
- 2If the amount of heat given to a system be $35$ joules and the amount of work done by the system be $ - 15$ joules, then the change in the internal energy of the system is .... $joules$View Solution
- 3The change in the entropy of a $1$ mole of an ideal gas which went through an isothermal process from an initial state $(P_1, V_1,T)$ to the final state $(P_2, V_2,T)$ is equal toView Solution
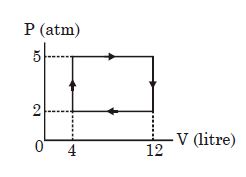
- 4View SolutionAn ideal gas undergoes a cyclic process as shown in diagram. The net work done by the gas in the cycle is
- 5View SolutionWhich is incorrect
- 6A Carnot engine works between $27^{\circ} C$ and $127^{\circ} C$. Heat supplied by the source is $500\, J$. then heat ejected to the sink is (in $J$)View Solution
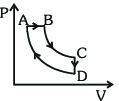
- 7A cyclic process $ABCDA$ is shown in the $P-V$ diagram. Which of the following curves represent the same processView Solution
- 8View SolutionWhich of the following parameters does not characterize the thermodynamic state of matter
- 9Determine coefficient of performance of given temperature limit.View Solution
$T_{1}=27^{\circ} C$ [outside fridge]
$T_{2}=-23^{\circ} C$ [inside fridge]
- 10The adjoining figure shows the $P-V$ diagram for a fixed mass of an ideal gas undergoing cyclic process. $AB$ represents isothermal process and $CA$ represents isochoric process.Which of the graph shown in the following figures represents the $P-T$ diagram of the cyclic process ?View Solution