MCQ
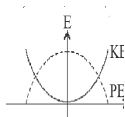
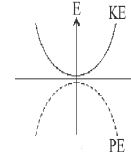
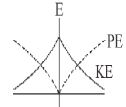
For a simple pendulum, a graph is plotted between its kinetic energy $(KE)$ and potential energy $(PE)$ against its displacement $d$. Which one of the following represents these correctly? (graphs are schematic and not drawn to scale)
- A
- B
- C
- ✓
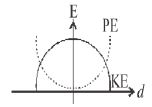
and $\mathrm{P.E.}=\frac{1}{2} k d^{2}$
At mean position $d=0 .$ At extremes positions $d=\mathrm{A}$
Generate a complete, print-ready paper with questions like this in minutes — across 16+ boards, with answer keys.