MCQ
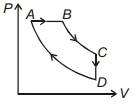
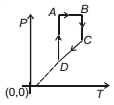
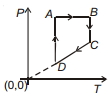
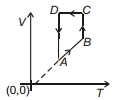
For $P-V$ diagram of a thermodynamic cycle as shown in figure, process $B C$ and $D A$ are isothermal. Which of the corresponding graphs is correct?
- A
- ✓
- C
- D
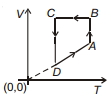
From $A \longrightarrow B$, volume increasing, pressure constant
$B \longrightarrow C$, Pressure $\propto \frac{1}{\text { Volume }} \Rightarrow$ Temperature constant
Same for $D \longrightarrow A$
$C \longrightarrow D$ pressure decreasing, volume constant
So $P \propto T$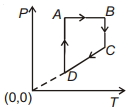
Generate a complete, print-ready paper with questions like this in minutes — across 16+ boards, with answer keys.