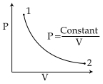
For the $P-V$ diagram given for an ideal gas, out of the following which one correctly represents the $T-P$ diagram ?
- A

- B

- C

- D

JEE MAIN 2017, Easy


Download our appand get started for free
Experience the future of education. Simply download our apps or reach out to us for more information. Let's shape the future of learning together!No signup needed.*
Similar Questions
- 1View SolutionVelocity of sound measured at a given temperature in oxygen and hydrogen is in the ratio
- 2A vessel contains $1$ mole of $O_2$ gas (molar mass $32$) at a temperature $T$. The pressure of the gas is $P$. An identical vessel containing one mole of $He$ gas (molar mass $4$) at a temperature $2T$ has a pressure ofView Solution
- 3View SolutionAccording to kinetic theory of gases, which of following statement will be true.
- 4View SolutionSelect the incorrect statement about Maxwell's speed distribution
- 5When $2 \,\,gms$ of a gas are introduced into an evacuated flask kept at $25\,^0C$ the pressure is found to be one atmosphere. If $3 \,\,gms$ of another gas added to the same flask the pressure becomes $1.5$ atmospheres. The ratio of the molecular weights of these gases will beView Solution
- 6The energy (in $eV$) possessed by a neon atom at $27^{\circ} C$ is ..............View Solution
- 7View SolutionThe molar specific heat at constant pressure for a monoatomic gas is
- 8The change in the magnitude of the volume of an ideal gas when a small additional pressure $\Delta P$ is applied at a constant temperature, is the same as the change when the temperature is reduced by a small quantity $\Delta T$ at constant pressure. The initial temperature and pressure of the gas were $300\, K$ and $2\; atm$ respectively. If $|\Delta T|=C|\Delta P|$ then value of $C$ in $(K / a t m)$ is......View Solution
- 9The temperature of an ideal gas is increased from $120\, K$ to $480\, K.$ If at $120\, K,$ the root mean square velocity of the gas molecules is $v,$ at $480\, K$ it becomesView Solution
- 10Speed of sound in a gas is $v$ and $r.m.s.$ velocity of the gas molecules is $c.$ The ratio of $v$ to $c$ isView Solution