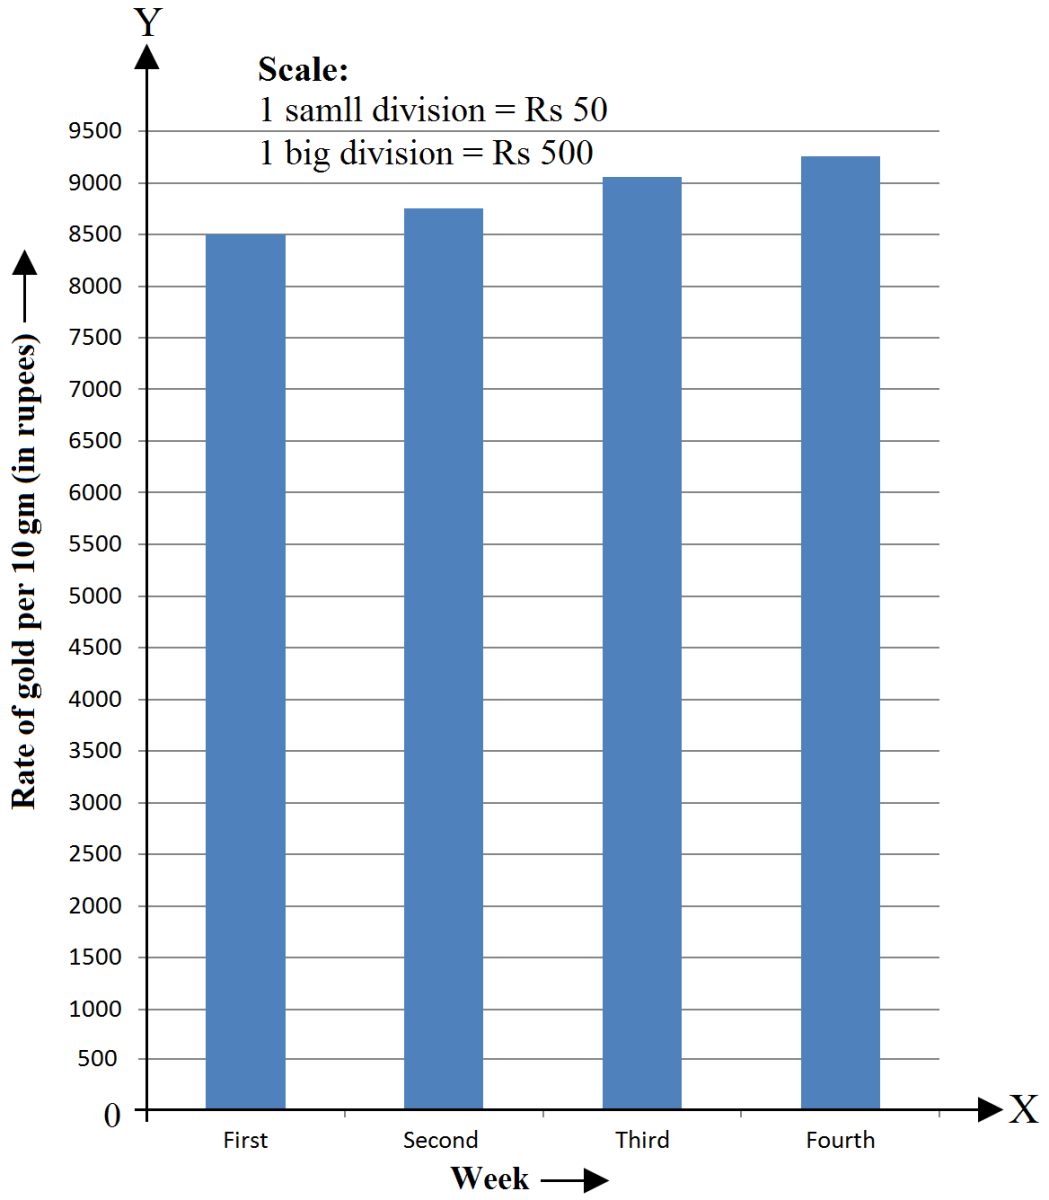
Question
Gold prices on $4$ consecutive Tuesdays were as under:
Week First Second Third Fourth
Rate per 10gm (in Rs.) $8500$ $8750$ $9050$ $9250$
Draw a bar graph to show this imformation.

Answer

We can draw the bar graph by following the given steps:
Step I: On a graph paper, draw a horizontal line $OX$ as X-axis and vertical line $OY$ as $Y-$axis.
Step II: Along $OX,$ write the names of the week at the points that are taken at a uniform gap.
Step III: Choose the scale: $1$ big division $= Rs.500$ $1$ small division $= Rs.50$
Step IV: Heights of the various bars: First week $= 170$ small divisions $= 17$ big divisions. Second week $= 175$ small divisions $= 17$ big divisions and $5$ small divisions. Third week $= 181$ small divisions $= 18$ big divisions and $1$ small division. Fourth week $= 185$ small divisions $= 18$ big divisions and 5 small divisions.
Step V: Draw bars of equal width on the $X-$axis. The difference between the two bars should also be the same. We get the following bar graph:

Need a full question paper?

Generate a complete, print-ready paper with questions like this in minutes — across 16+ boards, with answer keys.

Start Generating Free

Similar questions

Give the order of rotational symmetry for each figure.
Image
The table below gives the data of tourists visiting $5$ hill stations over two consecutive years. Study the table and answer questions that follow:
Hills
Nanital
Shimla
Manali
Mussorie
Kullu
$2008$
$4000$
$5200$
$3700$
$5800$
$3500$
$2009$
$4800$
$4500$
$4200$
$6200$
$4600$
$a.$ Draw a double bar graph to depict the above information using appropriate scale.
$b.$ Which hill station was visited by the maximum number of tourists in $2008?$
$c.$ Which hill station was visited by least number of tourists in $2009?$
$d.$ In which hill stations was there increase in number of tourists in $2009?$
Selling price of a toy car is $₹ 540$. If the profit made by shopkeeper is $20\%$, what is the cost price of this toy?
$2\text{y}-\frac12=-\frac13$
The mean of the following data is $20.6.$ Find the value of $p.$
x:
$10$
$15$
$p$
$25$
$35$
f:
$3$
$10$
$25$
$7$
$5$
Take the data giving the minimum and the maximum temperature of various cities given in Table. Plot a double bar graph using the data and answer the question: Name the city which has the least difference between its minimum and the maximum temperature.
Temperatures of Cities as on $20.6.2006$
City Max. Min.
Ahmedabad $38^{\circ} \mathrm{C}$ $29^{\circ} \mathrm{C}$
Amritsar $37^{\circ} \mathrm{C}$ $26^{\circ} \mathrm{C}$
Banglore $28^{\circ} \mathrm{C}$ $21^{\circ} \mathrm{C}$
Chennai $36^{\circ} \mathrm{C}$ $27^{\circ} \mathrm{C}$
Delhi $38^{\circ} \mathrm{C}$ $28^{\circ} \mathrm{C}$
Jaipur $39^{\circ} \mathrm{C}$ $28^{\circ} \mathrm{C}$
Jammu $41^{\circ} \mathrm{C}$ $26^{\circ} \mathrm{C}$
Mumbai $32^{\circ} \mathrm{C}$ $27^{\circ} \mathrm{C}$
If $x : y = 6 : 11$, find $(8x - 3y) : (3x + 2y).$
A room is 9 m long, 8 m broad and 6.5 m high. It has one door of dimensions $2 m \times 1.5 m$ and three windows each of dimensions $1.5 m \times 1 m$. Find the cost of white washing the walls at ₹ $ 3.80$ per square metre.
What should be subtracted from $x^2-x y+y^2-x+y+3$ to obtain $-x^2+3 y^2-4 x y+1$ ?
In Fig., $A D$ and $C F$ are respectively perpendiculars to sides $B C$ and $A B$ of $\triangle A B C$. If $\angle F C D=50^{\circ}$, find $\angle B A D$.
Image