Question
Gold prices on 4 consecutive Tuesdays were as under:
Week First Second Third Fourth
Rate per 10gm (in Rs.) 8500 8750 9050 9250
Draw a bar graph to show this imformation.

Answer

We can draw the bar graph by following the given steps:
Step I: On a graph paper, draw a horizontal line OX as X-axis and vertical line OY as Y-axis.
Step II: Along OX, write the names of the week at the points that are taken at a uniform gap.
Step III: Choose the scale:
1 big division = Rs 500
1 small division = Rs 50
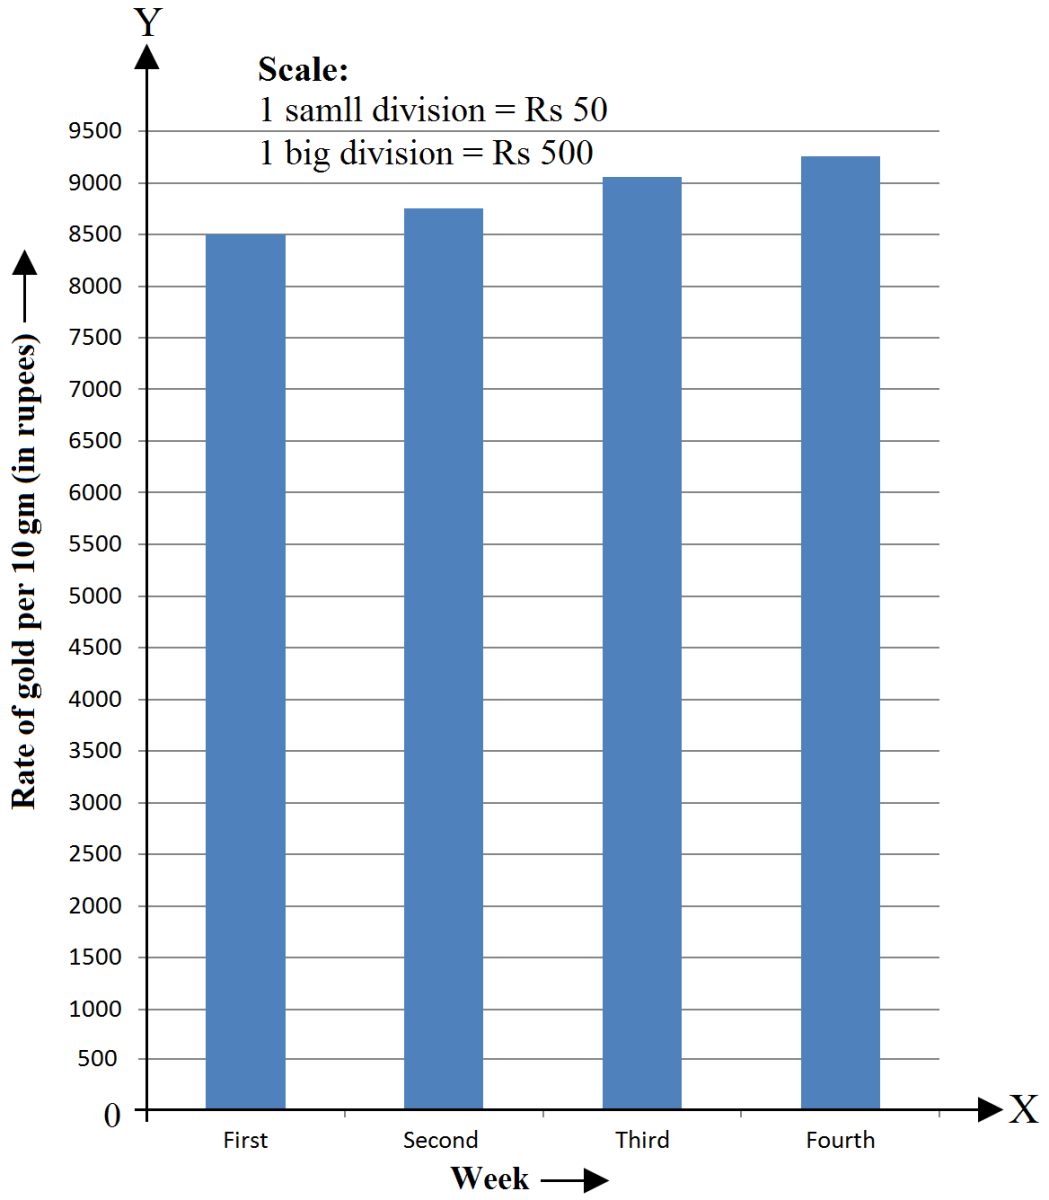
Step IV: Heights of the various bars:
First week = 170 small divisions = 17 big divisions.
Second week = 175 small divisions = 17 big divisions and 5 small divisions.
Third week = 181 small divisions = 18 big divisions and 1 small division.
Fourth week = 185 small divisions = 18 big divisions and 5 small divisions.
Step V: Draw bars of equal width on the X-axis. The difference between the two bars should also be the same.
We get the following bar graph:

Need a full question paper?

Generate a complete, print-ready paper with questions like this in minutes — across 16+ boards, with answer keys.

Start Generating Free

Similar questions

Complete the following multiplication table:
Second number
First number
x
-4
-3
-2
-1
0
1
2
3
4
-4


-3


-2


-1


0


1


2


3


4


ls the multiplication table symmetrical about the diagonal joining the upper left corner to the lower right corner?
Take any three non-collinear points A, B, C and draw $\angle\text{ABC}.$ Through each vertex of the triangle, draw a line parallel to the opposite side.
The following table shows the interest paid by India (in thousand crore rupees) on external debts during the period 1998-99 to 2002-03. Represent the data by a bar graph.
Year
1998-99
1999-2000
2000-01
2001-02
2002-03
Interest (in thousand crore rupees)
70
84
98
106
120
Virat and Samrat together invested Rs 50000 and Rs 120000 to start a business. They suffered a loss of 20%. How much loss did each of them incur ?
Draw any $\triangle\text{ABC}.$ Bisect side AB at D. Through D, draw a line parallel to BC, meeting AC in E. Measure AE and EC.
Find the value of p, if the mean of the following distribution is 20
x:
15
17
19
20 + p
23
f:
2
3
4
5 p
6
The air distances of four cities from Delhi (in km) are given below:
City
Kolkata
Mumbai
Chennai
Hyderabad
Distance from Delhi (in km)
1340
1100
1700
1220
Draw a bar graph to represent the above data.
Study the double bar graph given below and answer the questions that follow:
  1. What has been compared in the given double bar graph?
  2. What is the ratio of minimum temperatures in the year 2015 to the year 2016 in the month of November?
  3. Name the months in which the minimum temperature in 2015 was greater than that in 2016?
  4. Find the average minimum temperature for the year 2016 for the given four months.
  5. In which month is the variation in two temperatures maximum?
The table below shows the number of people who had the different juices at a juice bar on a Saturday and a Sunday. Draw a joint bar graph for this data.
Days\FruitsSweet LimeOrangeApplePineapple
Saturday47wQbNPTDJp9hMYdvogK2hAUiHsGeiybwaWe36bwtRQ3UTpYV7YuZ8FV5j9nauFCWwcjM6dTzpL5s2N79Rp5unwdMvc8ZKU="125">5640
Sunday59657867
A die is thrown 100 times and outcomes are noted as given below:
Outcome:
1
2
3
4
5
6
Frequency:
21
9
14
23
18
15
If a die is thrown at random, find the probability of getting a/ an:
  1. 3
  2. 5
  3. 4
  4. Even number
  5. Odd number
  6. Number less than 3