Chemical Kinetics — Chemistry STD 12 Science — Question
Maharashtra BoardEnglish MediumSTD 12 ScienceChemistryChemical Kinetics4 Marks
Question
How will you represent zeroth-order reaction graphically?
✓
Answer
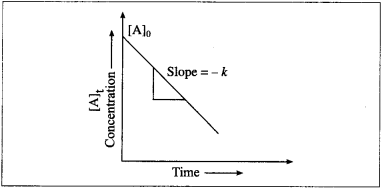
(1) A graph of concentration against time : In case of a zero-order reaction, the rate of reaction is independent of the concentration of the reactant. The concentration $[A]_t$ of the reactant at a time t is given by
$[A]_t = – kt + [A]_0 (y = – mx + c)$
where $[A]_0$ is the initial concentration of the reactant and k is a rate constant.
Hence in case of zero order reaction, when the concentration of the reactant is plotted against time, a straight line with the slope equal to – $k$ is obtained. The concentration of the reactants de-crease with time. The intercept on the concentration axis gives the initial concentration, $[A]_0$.
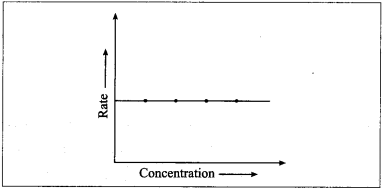
(2) A graph of rate of a reaction against the concen-tration of the reactant: Rate of a zero order reaction is independent of the concentration of the reactant.
Rate, $R = k [A]^0 = k$
Hence even if the concentration of the reactant decreases, the rate of the reaction remains constant.
Therefore if the rate of a zero order reaction is plotted against concentration, then a straight line with zero slope is obtained indicating, no change in the rate of the reaction with a change in the concentration of the reactants.
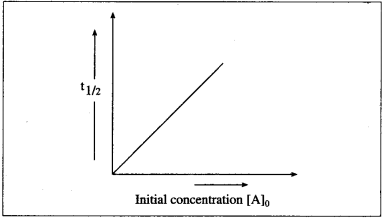
(3) A graph of half-life period against concentration : The half-life period of a zero-order reaction is given by, $t_{1 / 2}=\frac{[ A ]_0}{2 k}$
where $[A]_0$ is initial con-centration of the reactant and k is the rate constant. Hence the half-life period is directly proportional to the concentration.
When a graph of $t_{1/2}$ is plotted against concentration, a straight line passing through origin is obtained, and the slope gives $\frac{1}{2 k}$, where k is the rate constant.
Need a full question paper?
Generate a complete, print-ready paper with questions like this in minutes — across 16+ boards, with answer keys.