Question
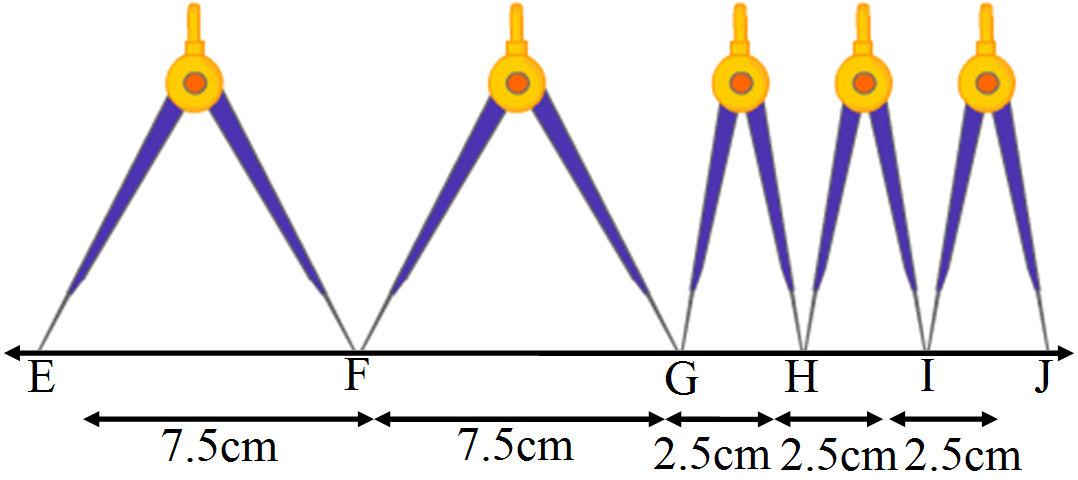
If AB = 7.5cm and CD = 2.5cm, construct a segment whose length is equal to:
2AB + 3CD

Answer

Given: AB= 7.5cm and CD = 2.5cm Draw AB and CD
Draw a line/ and take point Eon it. Now, take a divider and open it such that the ends of both its arms are at A and B. Then, we lift the divider and place its one end at E and other end (say F) on the line 1, as shown in the figure. Again, lift the divider and place its one end at F and another end (G) on the line 1, opposite to E. Now, reset the divider in such a way that the ends of its one hand are at C and the end of other hand is at D. Then, we lift the divider and place its one end at G and another end (say H) on the line 1, opposite to E as shown in the figure. Again, lift the divider and place its one end at H and other end (say I) on the line 1, opposite to E as shown in the figure. Again, lift the divider and place its one end at I and another end (say J) on the line 1, opposite to E as shown in the figure. EG is required line segment, whose length is equal to (2AB + 3CD).

Need a full question paper?

Generate a complete, print-ready paper with questions like this in minutes — across 16+ boards, with answer keys.

Start Generating Free

Similar questions

The following bar graph represent the heights (in cm) of 50 students of Class XI of a particular school. Study the graph and answer the following questions:
  1. What percentage of the total number of students have their heights more than 149cm?
  2. How many students in the class are in the range of maximum height of the class?
  3. The school wants to provide a particular type of tonic to each student below the height of 150cm to improve his height. If the cost of the tonic for each student comes out to be ₛ 55, how much amount of money is required?
  4. How many students are in the range of shortest height of the class?
  5. State whether true or false:
  1. There are 9 students in the class whose heights are in the range of 155-159cm.
  2. Maximum height (in cm) of a student in the class is 17.
  3. There are 29 students in the class whose heights are in the range of 145-154cm.
  4. Minimum height (in cm) of a student is the class is in the range of 140-144cm.
  5. The number of students in the class having their heights less than150cm is 12.
  6. There are 14 students each of whom has height more than 154cm.
Draw the perpendicular bisector of a given line segment AB of length 6cm.
Write all the factors of the given numbers and list their common factors:
i. 12, 16
ii. 21, 24
iii. 25, 30
iv. 24, 25
v. 56, 72
Following figures relate the weekly wages (in Rs.) of 15 workers in a factory:
300, 250, 200, 250, 200, 150, 350, 200, 250, 200, 150, 300, 150, 200, 250
Prepare a frequency table
  1. What is the range in wages (in Rs.)?
  2. How many Workers are getting Rs. 350?
  3. How many of workers are getting the minimum wages?
Arrange the following numbers in descending order:
190909, 1808088, 16060666, 16007777, 181888, 1808090
This bar graph shows the maximum temperatures in degrees Celsius in different cities on a certain day in February. Observe the graph and answer the questions:

Image

  1. What data is shown on the vertical and the horizontal lines?
  2. Which city had the highest temperature?
  3. Which cities had equal maximum temperatures?
  4. Which cities had a maximum temperature of 30 °C?
  5. What is the difference between the maximum temperatures of Panchgani and Chandrapur?
Ravish's house is $\frac{9}{10}\text{km}$ from his school. He walked some distance and then took a bus for $\frac{1}{2}\text{km}$ up to the school. How far did he walk?
The number of customers who came to a juice centre during one week is given in the table below. Make two different bar graphs to show this data.
(On Y-axis, 1 cm = 10 customers, 1 cm = 5 customers)
Type of juiceOrangePineappleAppleMangoPomegranate
Number of customers5030256510
Draw a line AB and take two points C and E on opposite sides of AB. Through C, draw $\text{CD}\perp\text{AB}$ and through E draw $\text{EF}\perp\text{AB}.$ Using ruler and compassed.
Construct a frequency distribution table for the following marks obtained by 25 students in a history test in class VI of a school:
9, 17, 12, 20, 9, 18, 25, 17, 19, 9, 12, 9, 18, 17, 19, 20, 25, 9, 12, 17, 19, 19, 20, 9
  1. What is the range of marks?
  2. What is the highest mark?
  3. Which mark is occurring more frequently?