MCQ
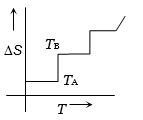
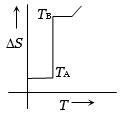
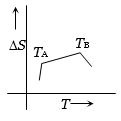
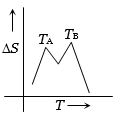
If for a given substance melting point is ${T_B}$ and freezing point is ${T_A}$, then correct variation shown by graph between entropy change and temperature is
- ✓
- B
- C
- D
Generate a complete, print-ready paper with questions like this in minutes — across 16+ boards, with answer keys.