If the length of second's pendulum is decreased by $2\%$, how many seconds it will lose per day ...... $\sec$
Medium
Download our app for free and get started
(d) $T \propto \sqrt l $
==> $\frac{{\Delta T}}{T} = \frac{1}{2}\frac{{\Delta l}}{l} = \frac{{0.02}}{2} = 0.01$
==>$\Delta T = 0.01\,T$
Loss of time per day $ = 0.01 \times 24 \times 60 \times 60$$ = 864\sec $

Download our appand get started for free
Experience the future of education. Simply download our apps or reach out to us for more information. Let's shape the future of learning together!No signup needed.*
Similar Questions
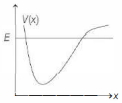
- 1Consider a one-dimensional potential $V(x)$ as shown in the figure below. A classical particle of mass $m$ moves under its influence and has total energy $E$ as shown below. The motion isView Solution
- 2Three simple harmonic motions of equal amplitudes $A$ and equal time periods in the same direction combine. The phase of the second motion is $60^o$ ahead of the first and the phase of the third motion is $60^o$ ahead of the second. Find the amplitude of the resultant motionView Solution
- 3The position co-ordinates of a particle moving in a $3-D$ coordinates system is given by $x = a\,cos\,\omega t$ , $y = a\,sin\,\omega t$ and $z = a\omega t$ The speed of the particle isView Solution
- 4Two bodies $M$ and $N $ of equal masses are suspended from two separate massless springs of force constants $k_1$ and $k_2$ respectively. If the two bodies oscillate vertically such that their maximum velocities are equal, the ratio of the amplitude $M$ to that of $N$ isView Solution
- 5A uniform spring of force constant $k$ is cut into two pieces, the lengths of which are in the ratio $1 : 2$. The ratio of the force constants of the shorter and the longer pieces isView Solution
- 6An object of mass $0.2\ kg$ executes simple harmonic along $X-$ axis with frequency of $\frac{{25}}{\pi } Hz$ . At the position $x$ = $0.04\ m$ , the object has kinetic energy of $0.5\ J$ and potential energy of $0.4\ J$ amplitude of oscillation in meter is equal toView Solution
- 7A body performs $S.H.M.$ Its kinetic energy $K$ varies with time $t$ as indicated by graphView Solution
- 8If the length of a clock pendulum increases by $0.2 \%$ due to atmospheric temperature rise, then the loss in time of clock per day is ........... $s$View Solution
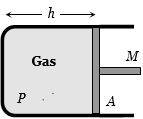
- 9A cylindrical piston of mass $M$ slides smoothly inside a long cylinder closed at one end, enclosing a certain mass of gas. The cylinder is kept with its axis horizontal. If the piston is disturbed from its equilibrium position, it oscillates simple harmonically. The period of oscillation will beView Solution
- 10The oscillation of a body on a smooth horizontal surface is represented by the equation $x= Acos$$\omega t$View Solution
where $x=$ displacement at time $t$
$\omega =$ frequency of oscillation
Which one of the following graphs shows correctly the variation $a$ with $t$ ?
Here $a=$ acceleration at time $t$
$T=$ time period