Question
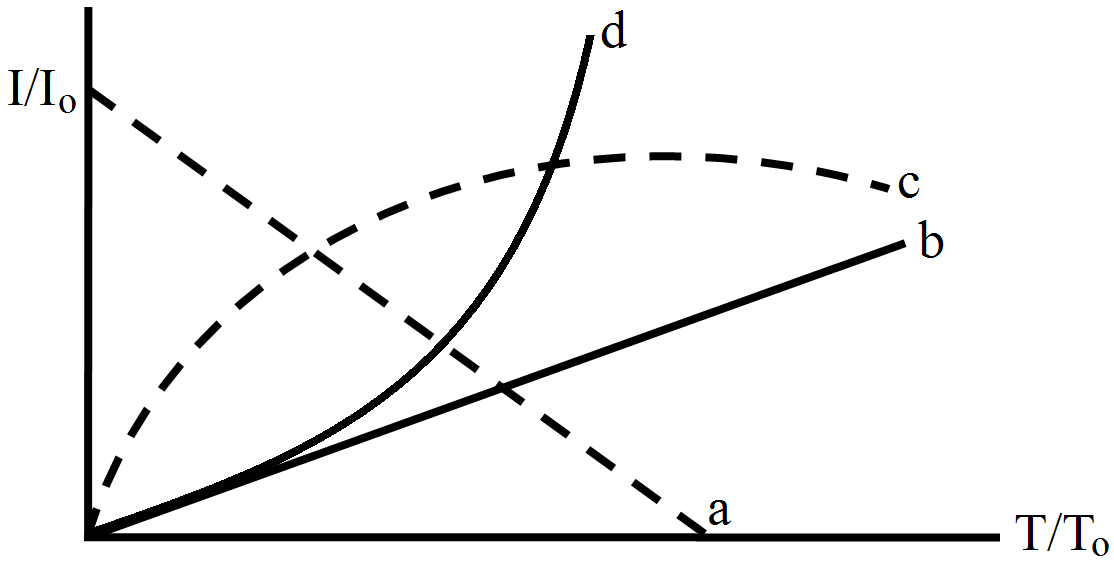
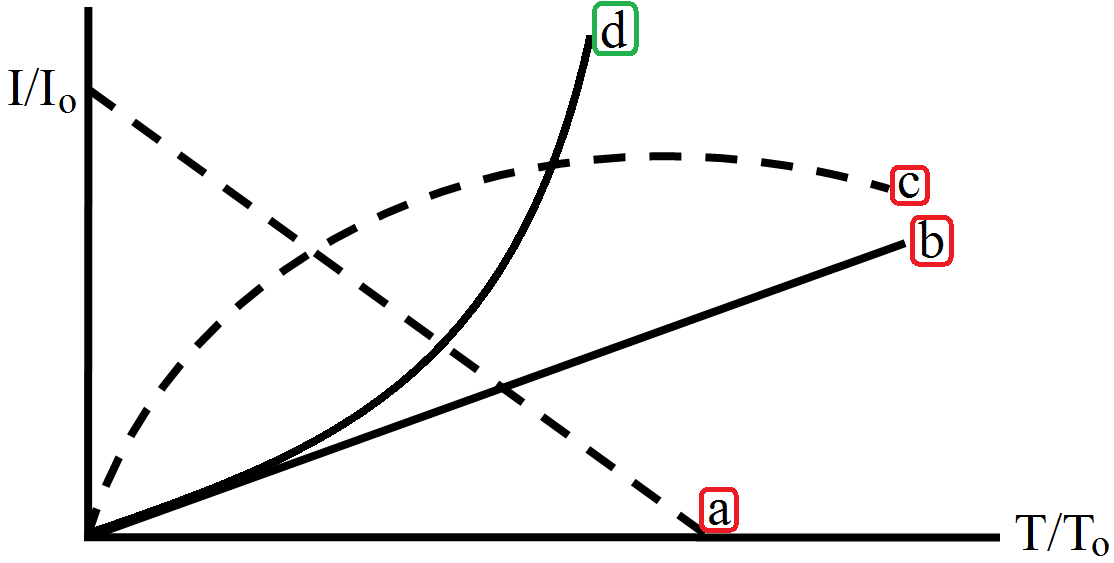
Let $\text{i}_0$ be the thermionic current from a metal surface when the absolute temperature of the surface is $\text{T}_0$. The temperature is slowly increased and the thermionic current is measured as a function of temperature. Which of the following plots may represent the variation in $\Big(\frac{\text{i}}{\text{i}_0}\Big)$ against $\Big(\frac{\text{T}}{\text{T}_0}\Big)?$