Question
Observe the toothpick pattern given below: 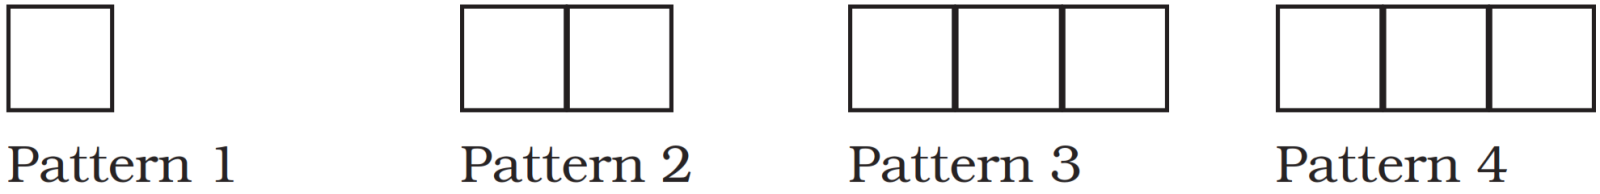
$a.$ Imagine that this pattern continues. Complete the table to show the number of toothpicks in the first six terms.
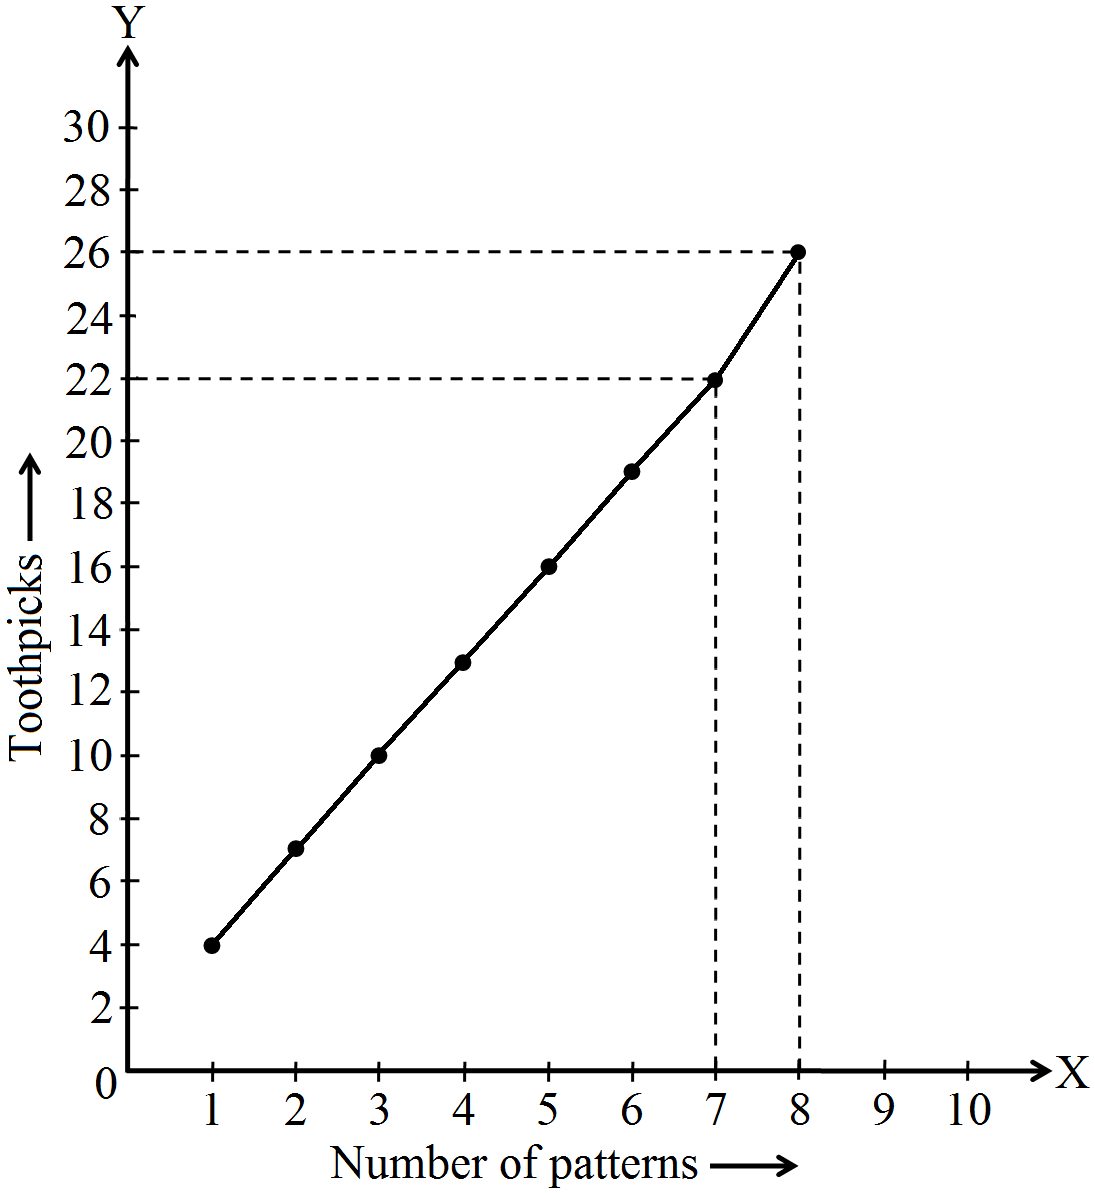
$b.$ Make a graph by taking the pattern numbers on the horizontal axis and the number of toothpicks on the vertical axis. Make the horizontal axis from $0$ to $10$ and the vertical axis from $0$ to $30.$
$c.$ Use your graph to predict the number of toothpicks in patterns $7$ and $8$. Check your answers by actually drawing them.
$d.$ Would it make sense to join the points on this graph? Explain.
$a.$ Imagine that this pattern continues. Complete the table to show the number of toothpicks in the first six terms.
|
Pattern
|
$1$
|
$2$
|
$3$
|
$4$
|
$5$
|
$6$
|
|
Toothpicks
|
$4$
|
|
|
$15$
|
|
$c.$ Use your graph to predict the number of toothpicks in patterns $7$ and $8$. Check your answers by actually drawing them.
$d.$ Would it make sense to join the points on this graph? Explain.