Question
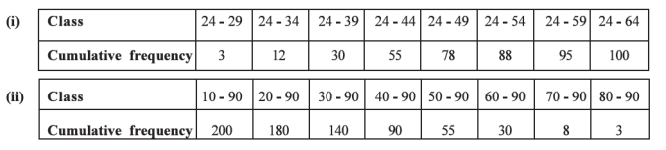
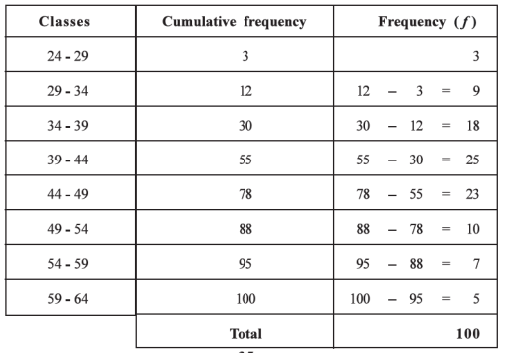
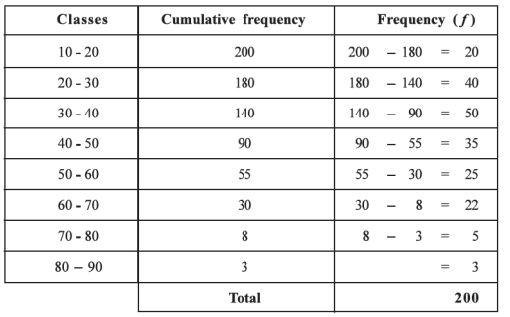
Obtain the original frequency distribution from the following frequency distribution:

Answer

$(i)$ “Less than’ type cumulative frequency distribution is given here. The orginal frequency distribution can be obtained from it as under :

$(i)$ “More than’ type cumulative frequency distribution is given here. The original frequency distribution can be obtained from it as under :

Need a full question paper?

Generate a complete, print-ready paper with questions like this in minutes — across 16+ boards, with answer keys.

Start Generating Free

Similar questions

The following table shows the number of units of electricity consumption of different families :
No. of units Below $200$ $200 – 300$ $300 – 400$ $400 – 500$ $500$ and above
No. of families $7$ $13$ $24$ $16$ $10$
Find the median consumption.
Discuss the characteristics of an ideal questionnaire.
The distribution of number of flowers on $100$ plants of a nursery is given below. Find the coefficient of skewness by Karl Pearson's method and interpret it.
No. of flowers $25$ $23$ $21$ $19$ $17$ $15$ $13$ $11$
No. of plants $4$ $10$ $18$ $22$ $20$ $8$ $13$ $5$
In how many ways can $5$ boys and $2$ girls be arranged in a row such that,
$(1)$ both the girls are together ?
$(2)$ both the girls are not together ?
The marks in a test for a group of students are as follows. Find the mean marks of these students.
Marks
$0-10$ $10-20$ $20-30$ $30-40$ $40-50$ $50-60$ $60-70$
No. of students
$3$ $5$ $12$ $16$ $11$ $5$ $4$
The sum of the first terms of the $G.P. y.$ $\frac{ y }{ 3 }, \frac{ y }{9}, \ldots$ (where, $y>0$ ) is $121.$ Find $y$.
The mean of $20$ observations is $63$ and $S.d.$ is $2.$ It is found that one observation is taken $60$ instead of $62$. Find the correct values of mean and $S.d.$ of the data.
The frequency distribution of sale of notebooks from a stationery shop in the month of June for the year $2014$ is as follows. Find coefficient of skewness using Karl Pearson’s method.
Sale of notebooks (in dozens) $30$ $25$ $21$ $20$ $18$ $16$ $15$ $12$
No. of days $2$ $2$ $7$ $3$ $4$ $7$ $2$ $3$
The number of bags of wheat sold in a grocer’s shop each day shown in the following table :
No. of bags $25 – 29$ $3 0 – 34$ $35 – 39$ $40 – 44$ $45 – 49$ $50 – 54$ $55$ and above
No. of days $9$ $17$ $32$ $24$ $10$ $5$ $3$
Find $Q_1$ and $D_4$ for the number of bags sold.
The data of daily average income (in $₹$ ) for $40$ hawkers of a city are as follows. Prepare an exclusive frequency distribution having classlength $100$ and midvalue of one of the classes as $650$ .
$\text{539 476 513 436 453 670 953 972 691 587}$
$\text{822 999 469 447 442 680 513 560 737 687}$
$\text{1044 891 560 481 478 460 476 563 558 1080}$
$\text{1033 707 660 602 503 493 504 443 550 900}$