Question 14 Marks
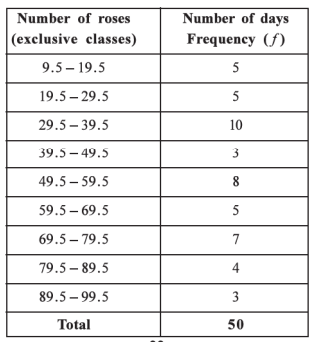
By considering the inclusive frequency distribution obtained in illustration $3$, find
$(i)$ Exclusive frequency distribution and
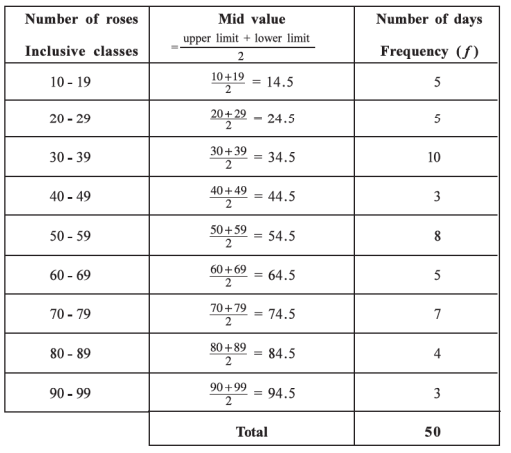
$(ii)$ Frequency distribution showing mid value of each class.
Answer$(i)$ In illustration $3$, upper limit of the first class is $19$ and the lower limit of the second class is $20$ and its class length is $10$. Lower boundary point of the second class is $\frac{20+19}{2}=19.5$ and its upper boundary point is $19.5+10=29.5$. Thus, the class boundaries for the second class are $19.5-29.5$ and class boundaries for the first class are $9.5-19.5$.
The alternate method for calculating these is as under:
Upper limit for the first class is $19$ and the lower limit for the next class is $20$ . The difference of these two limits $(20-19=1)$ is divided by $2$ , which gives $0.5$. Now subtract $0.5$ from the lower limit and add $0.5$ to the upper limit of a each class. We have the lower boundary point and upper boundary point of each class as under:
$(ii)$ Mid value of a class is obtained by taking average of the upper limit and the lower limit of that class. Hence the frequency distribution showing the mid value of each class is as under :
View full question & answer→Question 24 Marks
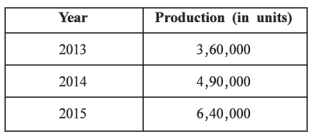
The data on the production of an industrial unit during three years is as under.
Present it by using circle diagram.
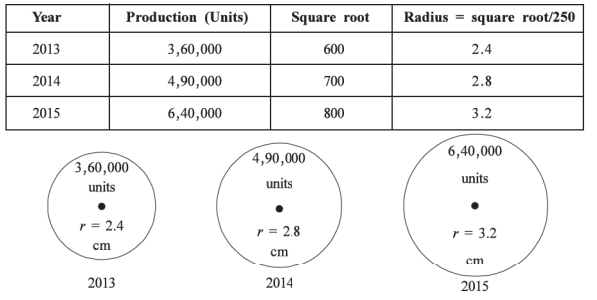
AnswerAs the given data are numerically large, radius is taken as the square root of each value which is
further divided by 250.
View full question & answer→Question 34 Marks
Obtain the original frequency distribution from the following frequency distribution:
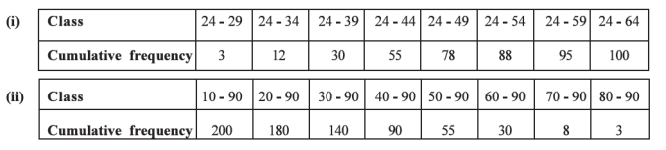
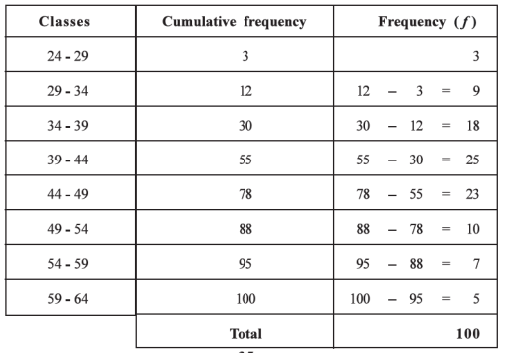
Answer$(i)$ “Less than’ type cumulative frequency distribution is given here. The orginal frequency distribution can be obtained from it as under :
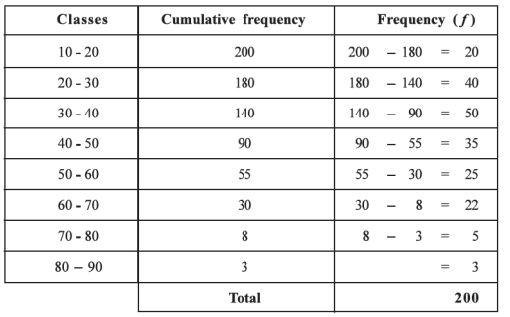
$(i)$ “More than’ type cumulative frequency distribution is given here. The original frequency distribution can be obtained from it as under :
View full question & answer→Question 44 Marks
Changes in prices of shares during a (lay of $40$ different companies registered at Bombay stock exchange are as follows. Find an inclusive continuous frequency distribution having mid value $—]$ for one of the classes and regular class length as $5$.
$\text{-8 8 7 16 8 22 6 10 -7 5}$
$\text{3 -4 9 -11 11 16 9 -3 -11 2}$
$\text{5 -6 10 -6 13 -5 3 -7 12 0}$
$\text{7 6 12 -5 21 0 4 -10 14 -2}$
Answer'Changes in the price of share' is a continuous variable.
The class limits of a class having mid value $-1$ and class length $C=5$ are :
$ \text { Lower limit } =\text { Mid value }-\frac{1}{2} C$
$ =-1-\frac{1}{2}(5)$
$ =-3.5$
$\text { Upper limit } =\text { Mid value }+\frac{1}{2} C$
$ =-1+\frac{1}{2}(5)$
$ =1.5 $
Hence that class is $-3.5$ to $1.5$ which is exclusive class.
$ \text { Converting it into the inclusive class, we get } -3.5+0.5 \text { to } 1.5-0.5$ $ =-3 \text { to } 1 $ In the given data, the minimum value is $-11$ and its maximum value is $22$ .
Hence the remaining classes should be made by including these values.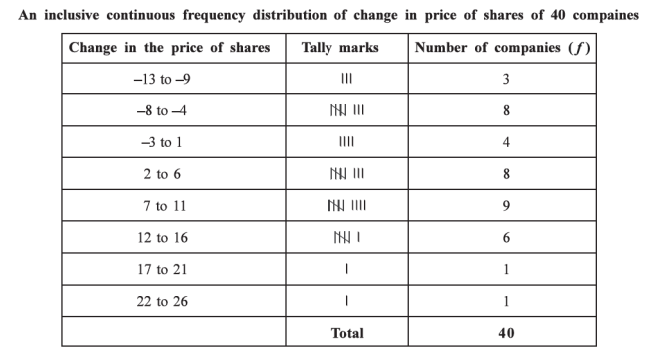
View full question & answer→Question 54 Marks
Present the following data in an appropriate tabular form. A bank receives $2000$ applications as a response to the job advertisement. Of the total applicants, $50\%$ were graduates, $40\%$ were post graduates and remaining $10\%$ have professional degree. Among the graduates, $60\%$ were males and of them, $25\%$ were married. $40\%$ female graduates were married. Among the post graduates, $60\%$ were males and $40\%$ of them were married. Among post graduate
females, $50\%$ were married. $30\%$ of the females had professional degree and of them, $60\%$ were married. The number of married and unmarried males having professional degree was equal.
Answer
- According to these three attribute, table is Prepared as follows :
Table showing the number of candidates for service in a bank according to their study, sex and marital status
| Study |
Sex |
Total no. of Candidates |
| Male |
Female |
| Married |
Unmarried |
Total |
Married |
Unmarried |
Total |
Married |
Unmarried |
Total |
| Graduate |
$150$ |
$450$ |
$600$ |
$160$ |
$240$ |
$400$ |
$310$ |
$690$ |
$1000$ |
| Post – graduate |
$192$ |
$288$ |
$480$ |
$160$ |
$160$ |
$320$ |
$352$ |
$448$ |
$800$ |
| Professional |
$70$ |
$70$ |
$140$ |
$36$ |
$24$ |
$60$ |
$106$ |
$94$ |
$200$ |
| Total |
$412$ |
$808$ |
$1220$ |
$356$ |
$424$ |
$780$ |
$768$ |
$1232$ |
$2000$ |
View full question & answer→Question 64 Marks
In the year $201$3, there were $1200$ students studying in a school and of them, $400$ were girls, $5O$ girls were not residing in hostel. In all $600$ boys were residing in hostel. In the year $2014$, there is an increase of $20\%$ in the number of boys and the number of girls increased by $30\%$. During this year, $260$ boys and $100$ girls were not residing in hostel.
In the year $2015, 140$ boys and $100$ girls were newly admitted in the school and all of them resided with the hostel students. Present above data in a tabular form.
In the given data three attributes are :
$(1)$ Year $: 2013, 2014, 2015$
$(2)$ Residence : Hostel, Not in hostel
$(3)$ Sex: Boys, Girls
AnswerAccording to these three attributes, table is prepared as follows :
Table showing the number of students of a school according to their residence and sex during the years $2013$ to $2015$
| Year |
Residence |
Total number of students |
| Residing in hostel |
Not residing in hostel |
| Boys |
Girls |
Total |
Boys |
Girls |
Total |
Boys |
Girls |
Total |
| $2013$ |
$600$ |
$350$ |
$950$ |
$200$ |
$50$ |
$250$ |
$800$ |
$400$ |
$1200$ |
| $2014$ |
$700$ |
$420$ |
$1120$ |
$260$ |
$100$ |
$360$ |
$960$ |
$520$ |
$1480$ |
| $2015$ |
$840$ |
$520$ |
$1360$ |
$260$ |
$100$ |
$360$ |
$1100$ |
$620$ |
$1720$ |
View full question & answer→Question 74 Marks
There were $850$ students studying in higher standards of a school. The number of students in standard $10, 11$ and $12$ were in the proportion $8 : 5 : 4$. In standard $10$, the number of boys is $30\%$ of the number of students in the school. In standard $11$, the numbers boys and girls are equal. In standard $12$, the number of boys is three times the number of girls. Present the above data in a tabular form.
Answer
- In the given data two attributes are :
- $(1)$ Standard : $10, 11, 12$ $(2)$ Sex : Boys, Girls
- According to these two attributes table is prepared as follows :
Table showing the number of students of a school according to their standard and sex
| Standard |
Sex |
Total number of students |
| Boys |
Girls |
| $10$ |
$255$ |
$145$ |
$400$ |
| $11$ |
$125$ |
$125$ |
$250$ |
| $12$ |
$150$ |
$50$ |
$200$ |
| Total |
$530$ |
$320$ |
$850$ |
View full question & answer→Question 84 Marks
Obtain ‘less than’ type and ‘more than’ type cumulative frequency distribution from the following frequency distribution :
| Class |
$25-29$ |
$30-34$ |
$35-39$ |
$40-44$ |
$45-49$ |
$50-54$ |
$55-59$ |
$Total$ |
| Frequency |
$3$ |
$8$ |
$10$ |
$5$ |
$15$ |
$8$ |
$1$ |
$50$ |
Answer
| Class |
Frequency $f$ |
‘Less than’ type cumulative frequency distribution |
‘More than’ type cumulative frequency distribution |
| Less than upper boundary point |
Cumulative frequency $cf$ |
More than or equal to lower boundary point |
Cumulative frequency
$cf$ |
| $25 -29$ |
$3$ |
$24.5$ |
$0 =0$ |
$24.5$ |
$50-0 =50$ |
| $30 -34$ |
$8$ |
$29.5$ |
$0+3 =3$ |
$29.5$ |
$50 -3 =47$ |
| $35 -39$ |
$10$ |
$34.5$ |
$3+8 =11$ |
$34.5$ |
$47 -8 = 39$ |
| $40 -44$ |
$5$ |
$39.5$ |
$11 +10 = 21$ |
$39.5$ |
$39 -10 = 29$ |
| $45-49$ |
$15$ |
$44.5$ |
$21+5 = 26$ |
$44.5$ |
$29-5 = 24$ |
| $50 -54$ |
$8$ |
$49.5$ |
$26 + 15 = 41$ |
$49.5$ |
$24 -15 = 9$ |
| $55 -59$ |
$1$ |
$54.5$ |
$41 +8 = 49$ |
$54.5$ |
$9-8 = 1$ |
| $-$ |
$-$ |
$59.5$ |
$49 +1 = 50$ |
$59.5$ |
$0$ |
| Total |
$n =50$ |
$-$ |
$-$ |
$-$ |
$-$ |
View full question & answer→Question 94 Marks
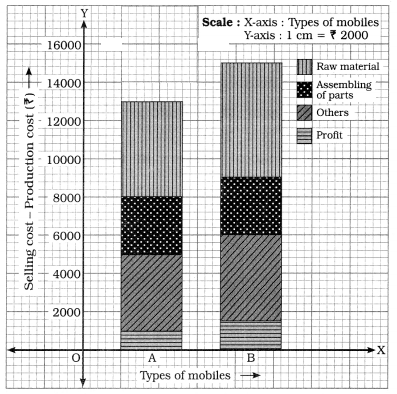
A mobile phone manufacturing company produces and sells two types of mobile phones. The particulars about it are given in the following table. Present it by a suitable diagram.
| Particulars |
Mobile $A$ |
Mobile $B$ |
| Raw material |
$5000$ |
$6000$ |
| Assembly expense |
$3000$ |
$3000$ |
| Other expense |
$4000$ |
$4500$ |
| Total expense |
$12000$ |
$13500$ |
| Selling price |
$13000$ |
$15000$ |
Answer
- In the given data, details of production cost and sales of two types mobiles of a company are given.
The expenditures of the different sections related to production are also given. Therefore considering the selling cost we draw simple divided bar diagram. For that we prepare the following table :
| Particulars |
Mobile $A$ |
Mobile $B$ |
| Expenditure $Rs.$ |
Dividing line |
Expenditure $Rs.$ |
Dividing line |
| Raw material |
$5000$ |
$13000 – 5000 = 8000$ |
$6000$ |
$15000 – 6000 = 9000$ |
| Assembling the |
$3000$ |
$8000 -3000 = 5000$ |
$3000$ |
$9000 – 3000 = 6000$ |
| Parts |
|
|
|
|
| Others |
$4000$ |
$5000 – 4000 = 1000$ |
$4500$ |
$6000 – 4500 =1500$ |
| Total expenditure |
$12000$ |
- |
$13500$ |
- |
| Selling cost |
$13000$ |
- |
$15000$ |
- |
| Profit = |
$(13000 – 12000)
=1000$ |
- |
$(15000 – 13500 ) = 1500$ |
|
| Selling cost – Total |
| expenditure |
- Drawing a bar proportional to sales, according production cost of different sections we divide the bar. The simple divided bar diagram is prepared :
View full question & answer→Question 104 Marks
Represent the following data through a bar diagram :
| Stream |
Arts |
Commerce |
Science |
Engineering |
Other |
| Number of students |
$5900$ |
$10,200$ |
$6000$ |
$4500$ |
$8000$ |
View full question & answer→Question 114 Marks
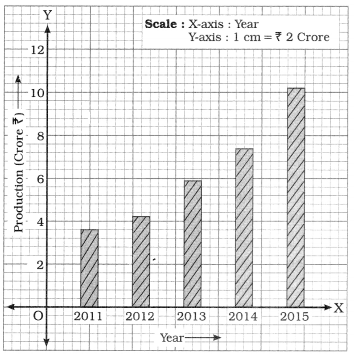
Represent the following data through a bar diagram :
| Year |
$2011$ |
$2012$ |
$2013$ |
$2014$ |
$2015$ |
| Production(in crore) |
$3.5$ |
$4.2$ |
$5.8$ |
$7.4$ |
$10.2$ |
Answer
Simple bar diagram showing the production for different years
View full question & answer→Question 124 Marks
Differentiate between inclusive and exclusive continuous frequency distribution.
Answer
| No. |
Inclusive Continuous Frequency Distribution |
No. |
Exclusive Continuous Frequency Distribution |
| $1.$ |
It is carried out for the discrete raw data having large value of range. |
$1.$ |
It is carried out for the continuous raw data. |
| $2$ |
The upper limit of each class and the lower limit of its succeeding class are not equal. |
$2.$ |
The upper limit of each class and the lower limit of its succeeding class are equal. |
| $3.$ |
The upper limit of a class is Included in that class. For example, $20-24, 25-29, 30-34, ....$etc. Here, upper limit $24$ is included in the class $20-24$. |
$3.$ |
The upper limit of a class is excluded from that class. For example, $20 - 25. 25-30, 30-35,....$
etc. Here, upper limit $25$ is excluded from the class $20-25$ and is included it its succeeding class $25-30.$ |
| $4.$ |
Class limits and class boundary points are not same. |
$4.$ |
Class limits are the class boundary points. |
View full question & answer→Question 134 Marks
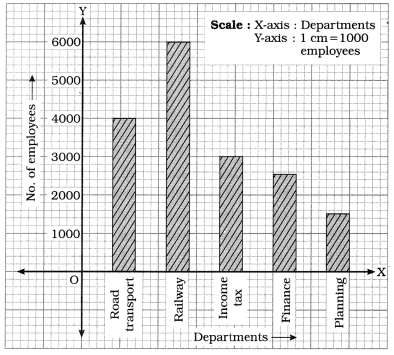
Following is the data on the number of employees working in various Government departments. Present it with a suitable diagram.
| Department |
Road transport |
Railway |
Income tax |
Finance |
Planning |
| Number of employees |
$4000$ |
$6000$ |
$3000$ |
$2500$ |
$1500$ |
Answer
- Here, Departments are shown on $X$-axis and taking scale $1 \ cm = 1000$ employees and drawing bars for different departments, simple bar diagram is prepared as in figure $1$ :
- In the given data, only one variable characteristic is the number of employees in different Department. Therefore, simple bar diagram is an appropriate diagram.
View full question & answer→Question 144 Marks
There were $1250$ skilled and $400$ unskilled workers in a private company in the year $2011$ . There were $220$ female workers and of them, $140$ were unskilled. In the year $2012$, the number of skilled workers was $1475$ and of them, $1300$ were males. Out of $250$ unskilled workers, $200$ were males. In $2013$, there were $1700$ skilled and $50$ unskilled workers. Out of total workers, $250$ were females of them $240$ were skilled. In the year $2014$ , there were $2000$ workers and of them, $2\%$ were unskilled. Out of total workers, $300$ were females and of them, $10$ were unskilled. Present the above data in the form of table.
Answer
| Year |
Skilled |
Unskilled |
Total workers |
| Male |
Female |
Total |
Male |
Female |
Total |
Male |
Female |
Total |
| $2011$ |
$1170$ |
$80$ |
$1250$ |
$260$ |
$140$ |
$400$ |
$1430$ |
$220$ |
$1650$ |
| $2012$ |
$1300$ |
$175$ |
$1475$ |
$200$ |
$50$ |
$250$ |
$1500$ |
$225$ |
$1725$ |
| $2013$ |
$1460$ |
$240$ |
$1700$ |
$40$ |
$10$ |
$50$ |
$1500$ |
$250$ |
$1750$ |
| $2014$ |
$1670$ |
$290$ |
$1960$ |
$30$ |
$10$ |
$40$ |
$1700$ |
$300$ |
$2000$ |
View full question & answer→Question 154 Marks
Out of total $1850$ women working in a factory, $549$ were residing in labour area. Out of total married women of labour area, $250$ had experience and $93$ were inexperienced, the number of experienced and inexperienced women from other area were $87$ and $400$ respectively. The total number of inexperienced women was $1336$ and out of them, $136$ were from labour area. Out of total women, $1020$ were unmarried. Among them, the number of experienced women from labour area and from other area were $163$ and $14$ respectively. Present these data in tabular form.
Answer
| Area of residence |
Marital status |
Total women |
| married |
Unmarried |
| Experienced |
Not experienced |
Total |
Experienced |
Not experienced |
Total |
Experienced |
Not experienced |
Total |
| Labour |
$250$ |
$93$ |
$343$ |
$163$ |
$43$ |
$206$ |
$413$ |
$136$ |
$549$ |
| Other |
$87$ |
$400$ |
$487$ |
$14$ |
$800$ |
$814$ |
$101$ |
$1200$ |
$1301$ |
| Total |
$337$ |
$493$ |
$830$ |
$177$ |
$843$ |
$1020$ |
$514$ |
$1336$ |
$1850$ |
View full question & answer→Question 164 Marks
$1600$ employees are working in an office. Among these employees the number of men exceeded the number of women by $15\%$ of the total number of employees. The number of unmarried employees are $800$ less than the number of married employees. The number of unmarried women is $195$. Represent the above data in a suitable table.
AnswerIn the given data, there are two attributes :
$(1)$ Sex of employees and $(2)$ Marital status.
According to these two attributes data is classified and table is prepared as follows :
Table showing the number of employees
working in an office according to their
sex and marital status
| Marital status |
Sex |
Total employees |
| Male |
Female |
| Married |
$715$ |
$485$ |
$1200$ |
| Unmarried |
$205$ |
$195$ |
$400$ |
| Total |
$920$ |
$680$ |
$1600$ |
View full question & answer→Question 174 Marks
There were $1400$ students studying in a commerce college. Among them, $855$ were boys and of them, $225$ boys were in the second year. In the second year, the number of boys and the number of girls are equal. Among the $550$ students of the first year, the proportion of number of boys and the girls is $3:2$. In the third year, number of boys is three times the number of girls. Represent the above information in a table.
Answer
- In the given data. there are two attributes :
- $(1)$ Year of study and $(2)$ Sex of students. Classifying the data on the basis of these two attributes. we prepare a table as follows :
Table showing the number of students
studying in a commerce college according
to their year of study and sex
| Year of study |
Sex |
No. of students |
| Boys |
Girls |
| First year |
$330$ |
$220$ |
$550$ |
| Second year |
$225$ |
$225$ |
$450$ |
| Third year |
$300$ |
$100$ |
$400$ |
| Total |
$855$ |
$545$ |
$1400$ |
View full question & answer→Question 184 Marks
Information regarding the number of accidents in a city during a year is as under. Find the inclusive continuous frequency distribution from it.
|
No. of accidents (Mid values)
|
$11.5$
|
$21.5$
|
$31.5$
|
$41.5$
|
$51.5$
|
Total
|
|
No. of days
|
$160$
|
$120$
|
$43$
|
$40$
|
$2$
|
$365$
|
Answer
| No. of accidents (Mid values) |
Class length c |
Lower limit = M.V.-(c)/(2) |
Upper limit = M.V.+(c)/(2) |
No. of accidents class |
Inclusive class |
Frequency f |
| $11.5$ |
$10$ |
$11.5-(10)/(2)=6.5$ |
$11.5+(10)/(2)=16.5$ |
$6.5-16.5$ |
$7-16$ |
$160$ |
| $21.5$ |
$10$ |
$21.5-(10)/(2)=16.5$ |
$21.5+(10)/(2)=26.5$ |
$16.5-26.5$ |
$17-26$ |
$120$ |
| $31.5$ |
$10$ |
$31.5-(10)/(2)=26.5$ |
$31.5+(10)/(2)=36.5$ |
$26.5-36.5$ |
$27-36$ |
$43$ |
| $41.5$ |
$10$ |
$41.5-(10)/(2)=36.5$ |
$41.5+(10)/(2)=46.5$ |
$36.5-46.5$ |
$37-46$ |
$40$ |
| $51.5$ |
$10$ |
$51.5-(10)/(2)=46.5$ |
$51.5+(10)/(2)=56.5$ |
$46.5-56.5$ |
$47-56$ |
$2$ |
| $-$ |
$-$ |
|
|
$-$ |
Total |
n = 365 |
View full question & answer→Question 194 Marks
| Mid values |
$25$
|
$105$
|
$230$
|
$400$
|
$650$
|
$900$
|
Total
|
|
Frequency
|
$10$
|
$30$
|
$40$
|
$60$
|
$80$
|
$30$
|
$250$
|
|
Class length
|
$50$
|
$110$
|
$140$
|
$200$
|
$300$
|
$200$
|
|
Obtain the original frequency distribution.Answer
| Mid value |
Class length |
Lower limit |
Upper limit |
Original frequency distibution |
| Class |
Frequency f |
| $25$ |
$50$ |
$25-\frac{50}{2}=0$ |
$25+\frac{50}{2}=50$ |
$0-50$ |
$10$ |
| $105$ |
$110$ |
$105-\frac{110}{2}=50$ |
$105+\frac{110}{2}=160$ |
$50-160$ |
$30$ |
| $230$ |
$140$ |
$230-\frac{140}{2}=160$ |
$230+\frac{140}{2}=300$ |
$160-300$ |
$40$ |
| $400$ |
$200$ |
$400-\frac{200}{2}=300$ |
$400+\frac{200}{2}=500$ |
$300-500$ |
$60$ |
| $650$ |
$300$ |
$650-\frac{300}{2}=500$ |
$650+\frac{300}{2}=800$ |
$500-800$ |
$80$ |
| $900$ |
$200$ |
$900-\frac{200}{2}=800$ |
$900+\frac{200}{2}=1000$ |
$800-1000$ |
$30$ |
| - |
- |
- |
|
Total |
$n = 250$ |
View full question & answer→Question 204 Marks
Obtain an exclusive continuous frequency distribution from the following data.
|
Less than weight (kg.)
|
$30$
|
$35$
|
$40$
|
$45$
|
$50$
|
$55$
|
$60$
|
$65$
|
$70$
|
|
Cumulative frequency
|
$0$
|
$17$
|
$25$
|
$40$
|
$48$
|
$54$
|
$57$
|
$59$
|
$60$
|
AnswerGiven data is ‘less than’ type cumulative frequency distribution.
Class length = Difference between two adjoining upper boundary points $= 35 – 30 = 5$
Now, lower boundary point of a class = upper boundary point – class length
∴ for initial class, lower boundary point $= 30 – 5 = 25$ and we get initial class $25 – 30.$
In this manner we will obtain class for each upper boundary point.
We find the frequency of a class as follows :
Frequency of a class = (‘less than ‘ cumulative frequency of a class) – (‘less than’ cumulative frequency of preceeding class)
Class frequency for upper boundary point $35 = 17 – 0 = 17$
In this manner, we will obtain the class frequency for each upper boundary point.
For the given data exclusive continuous frequency distribution is obtained as follows:
| 'Weight ‘less than’ in kg |
‘Less than’ cumulative frequency cf |
Weight(in kg) |
Frequency f |
| $30$ |
$0$ |
$25-30$ |
$= 0$ |
| $35$ |
$17$ |
$30-35$ |
$17- 0 = 17$ |
| $40$ |
$25$ |
$35-40$ |
$25 – 17 = 8$ |
| $45$ |
$40$ |
$40-45$ |
$40 – 25 = 15$ |
| $50$ |
$48$ |
$45-50$ |
$48 – 40 = 8$ |
| $55$ |
$54$ |
$50-55$ |
$54 – 48 = 6$ |
| $60$ |
$57$ |
$55-60$ |
$57 – 54 = 3$ |
| $65$ |
$59$ |
$60-65$ |
$59 – 57 = 2$ |
| $70$ |
$60$ |
$65-70$ |
$60 – 59 = 1$ |
| $–$ |
$–$ |
Total |
$n = 60$ |
View full question & answer→Question 214 Marks
The data regarding the number of mobile phones produced during last $60$ days by a mobile phone manufacturing company is given below. Distribute it into $10$ classes :
$\text{699 380 625 653 452 763 385 959 485 970 749 595 1029 500 499 453 525 621 465 565 103 785 286 1060 760 355 645 775 825 235 390 399 530 540 695 999 849 550 720 430 752 389 1075 701 875 552 351 265 199 370 1025 825 783 225 603 553 503 663 385 465}$
Obtain “less than’ and “more than’ type cumulative frequency distribution from it.
AnswerLess than’ type cumulative frequency distribution
| No. of mobiles 'less than' upper boundary point |
'Less than' cumulative frequency |
| $99.5$ |
$0 = 0$ |
| $199.5$ |
$0+2 = 2$ |
| $299.5$ |
$0+2+4 = 6$ |
| $399.5$ |
$0+2+4+9 = 15$ |
| $499.5$ |
$0+2+4+9+7 = 22$ |
| $599.5$ |
$0+2+4+9+7+10 = 32$ |
| $699.5$ |
$0+2+4+9+7+10+8 = 40$ |
| $799.5$ |
$0+2+4+9+7+10+8+9 = 49$ |
| $899.5$ |
$0+2+4+9+7+10+8+9+4 = 53$ |
| $999.5$ |
$0+2+4+9+7+10+8+9+4+3 = 56$ |
| $1099.5$ |
$0+2+4+9+7+10+8+9+4+3+4 = 60$ |
‘More than’ type cumulative frequency distribution
| No. of mobiles 'more than' or equal to lower boundary point |
'More than' cumulative frequency |
| $99.5$ |
$2+4+9+7+10+8+9+4+3+4 = 60$ |
| $199.5$ |
$4+9+7+10+8+9+4+3+4 = 58$ |
| $299.5$ |
$9+7+10+8+9+4+3+4 = 54$ |
| $399.5$ |
$7+10+8+9+4+3+4 = 45$ |
| $499.5$ |
$10+8+9+4+3+4 = 38$ |
| $599.5$ |
$8+9+4+3+4 = 28$ |
| $699.5$ |
$9+4+3+4 = 20$ |
| $799.5$ |
$4+3+4 = 11$ |
| $899.5$ |
$3+4 = 7$ |
| $999.5$ |
$0+4 = 4$ |
| $1099.5$ |
$0 = 0$ |
View full question & answer→Question 224 Marks
Obtain an inclusive continuous frequency distribution from the following data.
|
Lower boundary point or more than that
|
$44.5$
|
$49.5$
|
$54.5$
|
$59.5$
|
$64.5$
|
$69.5$
|
$74.5$
|
$79.5$
|
|
Cumulative frequency
|
$500$
|
$470$
|
$390$
|
$290$
|
$240$
|
$90$
|
$10$
|
$0$
|
AnswerFor the given data, we get the inclusive continuous frequency distribution as follows :
| Lower Boundary point or more |
More than’ cumulative frequency Cf |
Class |
Frequency f |
| $44.5$ |
$500$ |
$45-49$ |
$500 – 470 = 30$ |
| $49.5$ |
$470$ |
$50-54$ |
$470 – 390 = 80$ |
| $54.5$ |
$390$ |
$55-59$ |
$390 – 290 = 100$ |
| $59.5$ |
$290$ |
$60-64$ |
$290 – 240 = 50$ |
| $64.5$ |
$240$ |
$65-69$ |
$240 – 90 = 150$ |
| $69.5$ |
$90$ |
$70-74$ |
$90 – 10 = 80$ |
| $74.5$ |
$10$ |
$75-79$ |
$10 – 0 = 10$ |
| $79.5$ |
$0$ |
$80-84$ |
$= 0$ |
| $–$ |
$–$ |
Total |
$n = 500$ |
View full question & answer→Question 234 Marks
The area of $50$ plots (in sq. mt.) In an agriculture inquiry are as follows:
$\text{2360, 1090, 2000, 3005, 2773, 850, 1625, 2292, 2168, 2550, 6166, 2900, 1898, 700, 1785,2110, 2230, 2600, 3170, 2495, 1122, 3500, 7272, 968, 1290, 2010, 2700, 4590, 1170, 1100,2055, 760, 2390, 4700, 1995, 1380, 2512, 1570, 3672, 1268, 2175, 2400, 3200, 1800, 2660, 2865, 5575, 1440, 2300, 2695}.$
From the above information prepare a frequency distribution by taking class length $300$ for two initial classes, thereafter next four classes with class length $500$ and the rest of the classes with class length $1500$.
AnswerClasses : $700— 1000, 1000— 1300, 1300 - 1800, 1800— 2300, 2300— 2800, 2800 —3300, 3300-4800,4800— 6300, 6300— 7800$
Frequency : $4, 6, 5, 11, 12, 5, 4, 2, 1$
View full question & answer→Question 244 Marks
The data on quantity of wheat sold (in $\ kg$ ) in a grocery shop during $30$ days are as follows.Prepare a frequency distribution such that class length is $50$ and one of the classes is $250-299$.
$150,290,245,260,100,180,275,390,320,75,140$, $249,195,255,340,190,300,90,295,230,135,250$,$375,165,280,130,330,270,200,240 .$
Answer the following questions on the basis of frequency distribution:
$(1)$ Find the least possible sale of wheat of $20 \%$ days with more sale.
$(2)$ What is the expected sale of $5$ days in the fourth class?
$(3)$ Obtain the boundary points of fifth class.
$(4)$ Find the most possible sale of wheat of $20 \%$ days with less sale.
$(5)$ State the lower limit and upper limit of third class.
AnswerClasses : $50-99,100-149, \ldots \ldots \ldots \ldots \ldots, 350-399$
$F_{i}: 2,4,5,5,8,4,2$
$(1)$ $20 \%$ means $6$ days; least possible sale $300 \mathrm{~kg}$
$(2)$ Expected sale Mid value $=224.5 \mathrm{~kg}$
$(3)$ Lower boundary point $=249.5 ;$ Upper boundary point $=299.5$
$(4)$ $20 \%$ means initial $6$ days; most possible sale $149 \ kg$
$(5)$ Lower limit $150$, Upper limit $199$
View full question & answer→