Question
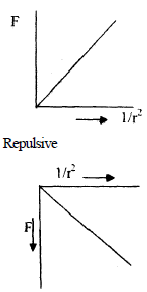
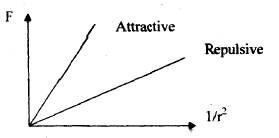
Plot a graph showing the variation of coulomb force (F) versus$\bigg(\frac{1}{\text{r}^{2}}\bigg)$; where r is the distance between the two charges of each pair of charges: (1 μC, 2 μC) and (2 μC, – 3 μC). Interpret the graphs obtained.
Generate a complete, print-ready paper with questions like this in minutes — across 16+ boards, with answer keys.