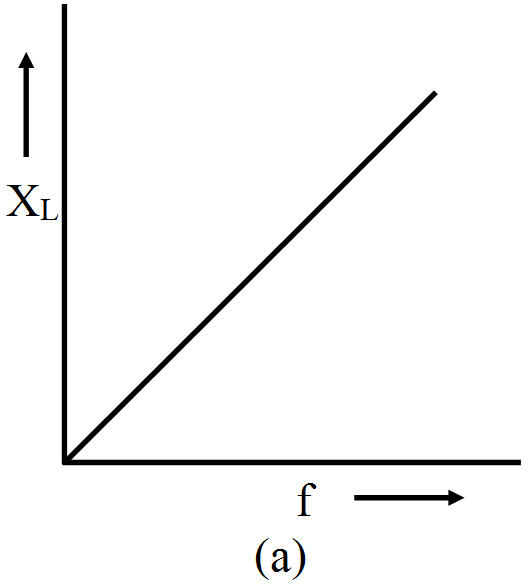
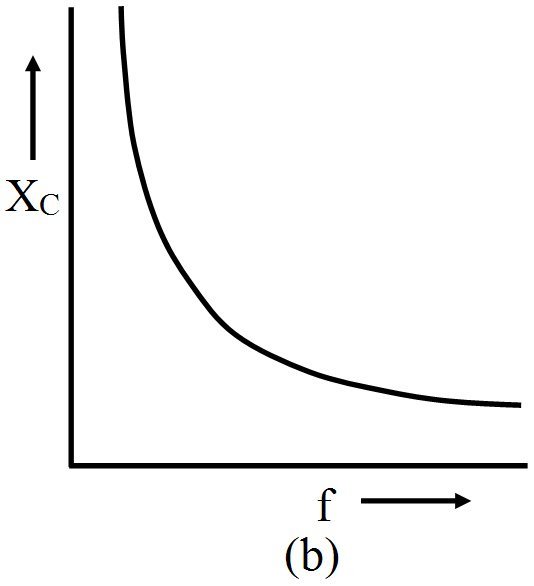
QuestionShareDraw the graphs showing variation of inductive reactance and capacitive reactance with frequency of applied a.c. source.