Question
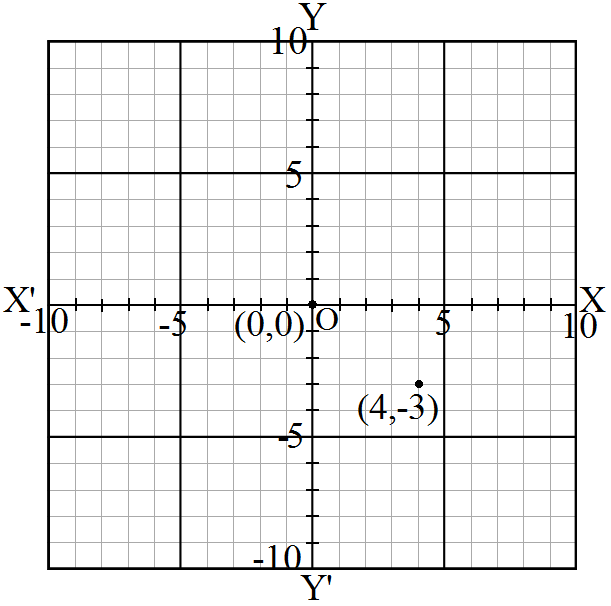
Plot the following points on the graph paper:
(4, -3)

Answer

The given points are,
A(2, 5), B(4, -3), C(-5, -7), D(7, -4), E(-3, 2), F(7, 0), G(-4, 0), H(0, -4), J(0, 0),
Let X'OX and Y'OY be the coordinate axes.
Here for the given point the abscissa is 4 units and ordinate is -3 units. The point is in the fourth quadrant. So it will look like as shown in the following figure.

Need a full question paper?

Generate a complete, print-ready paper with questions like this in minutes — across 16+ boards, with answer keys.

Start Generating Free

Similar questions

In $\triangle\text{ABC},$ if $\angle\text{A}=40^\circ$ and $\angle\text{B}=60^\circ.$ Determine the longest and shortest sides of the triangle.
A square is inscribed in an isosceles right triangle so that the square and the triangle have one angle common. Show that the vertex of the square opposite the vertex of the common angle bisects the hypotenuse.
Define an event.
Verify whether the indicated numbers are zeros of the polynomials corresponding to them in the following case:
$p(x) = x^3 - 6x^2 + 11x - 6, x = 1, 2, 3$
Two chords AB and CD of a circle intersect each other at P outside the circle. If AB = 6cm, BP = 2cm and PD = 25cm, find CD.
$x^4 - 2x^3 - 7x^2 + 8x + 12.$
Two chords AB and CD of lengths 5cm and 11cm respectively of a circle are parallel to each other and are opposite side of its centre. If the distance between AB and CD is 6cm, find the radius of the circle.
In the adjoining figure, □PQRS and □MNRL are rectangles. If point M is the midpoint of side PR, then prove that,
i. SL = LR
ii. $LN =\frac{1}{2} S Q$.

Image
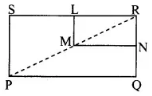
Given: □PQRS and □MNRL are rectangles. M is the midpoint of side PR.

Read the bar graph given in figure and answer the following questions:
  1. What information does it give?
  2. In which part the expenditure on education is maximum in 1980?
  3. In which part the expenditure has gone up from 1980 to 1990?
  4. In which part the gap between 1980 and 1990 is maximum?
The income and expenditure for 5 years of a family is given in the following data:
Years
1995–96
1996–97
1997–98
1998–99
1999–2000
Income (Rs. In thousands)
100
140
150
170
210
Expenditure (Rs. in thousands)
80
130
145
160
190
Represent the above data by a bar graph.