Question
Read the bar graph given in figure and answer the following questions: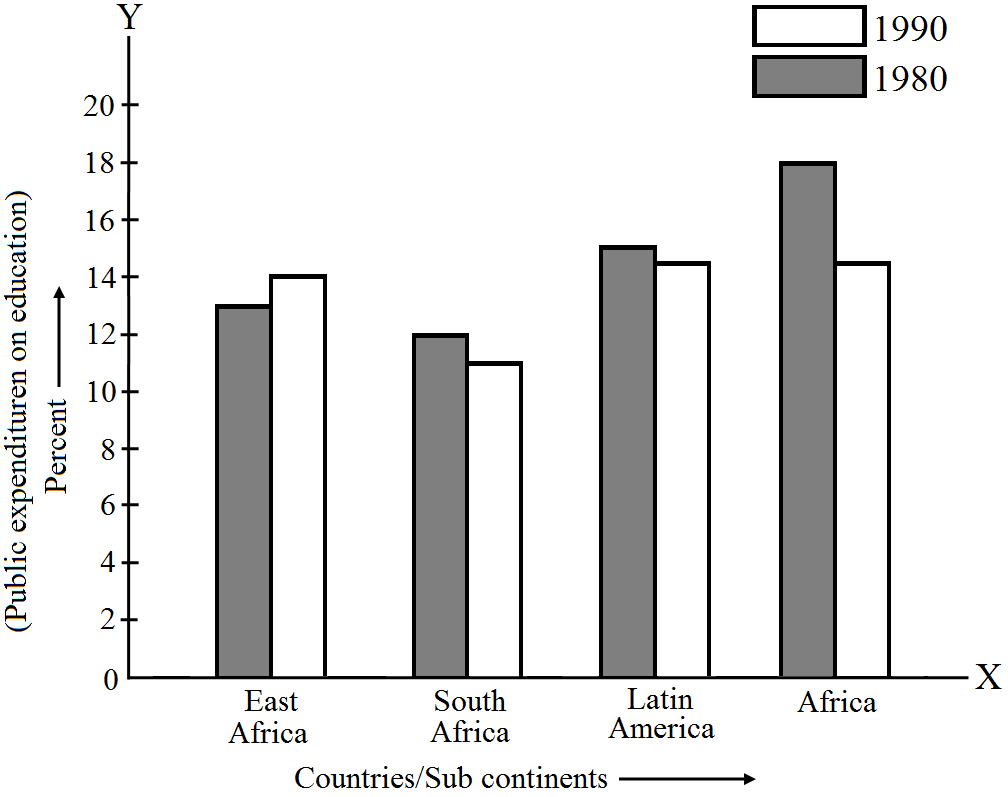
- What information does it give?
- In which part the expenditure on education is maximum in 1980?
- In which part the expenditure has gone up from 1980 to 1990?
- In which part the gap between 1980 and 1990 is maximum?