Question
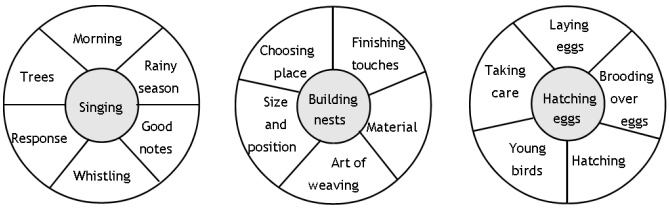
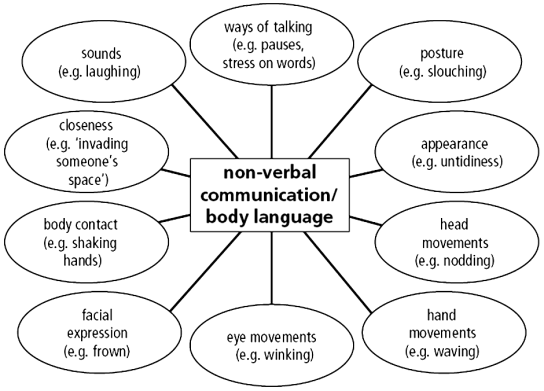
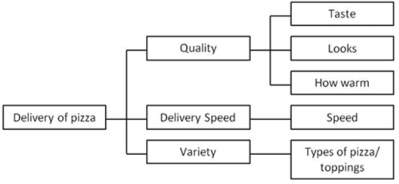
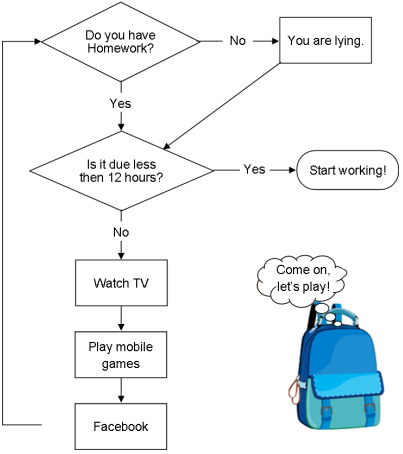
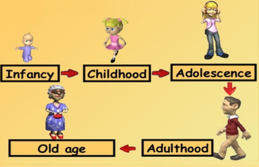
Read the information given in the diagram. Write a paragraph based on it. Give a suitable title to it.
Generate a complete, print-ready paper with questions like this in minutes — across 16+ boards, with answer keys.
| Peacock appearance | ..................... |
| Utility | ..................... |
| Female peacock | ..................... |
| Peacock sounds | ..................... |
| food | ..................... |
| No. | Summer Season | Rainy Season | |
| i. | Duration | ||
| ii. | Climate | ||
| iii. | Effect on human beings | ||
| iv. | Nature | ||
| v. | Prevention | ||
| vi. | Agricultural activities |
| Name of the storm | Features of the storm (If mentioned) | Places where they occur (If mentioned) |
| 1 | ||
| 2 | ||
| 3 | ||
| 4 | ||
| 5 |
| Year | 2005 | 2006 | 2007 | 2008 | 2009 | 2010 |
| Population in Lakhs | 35 | 40 | 50 | 65 | 90 | 105 |