Question
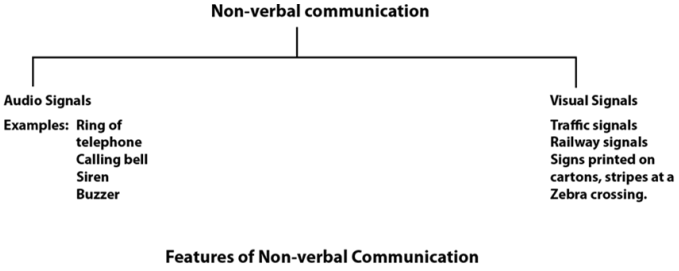
Read the information given in the flow chart. Write a paragraph explaining the flow chart. Give a suitable title to it.

Generate a complete, print-ready paper with questions like this in minutes — across 16+ boards, with answer keys.
| Damage caused | ..................... |
| City | ..................... |
| Sea | ..................... |
| Mountains | ..................... |
| Year | Place | No of people killed |
| ..................... | ..................... | ..................... |
| ..................... | ..................... | ..................... |


| Week | 2005 | 2006 | 2007 | 2008 | 2009 |
| Number of Bed-sheets | 600 | 850 | 700 | 300 | 900 |
Draw the bar graph representing the above data.
In the first week blue coloured bed sheets are manufactured, than in the second week red, third week yellow fourth week pink and fifth week orange coloured.
You put the above information in a bar graph.