Question
Read the Source/ Text given below and answer any four questions:
A recent survey by a labour organization of the state government of Odisha found that the wages of workers in a factory for different age groups are distributed as given in the bar graph. Read the bar graph carefully and answer the questions that follow.
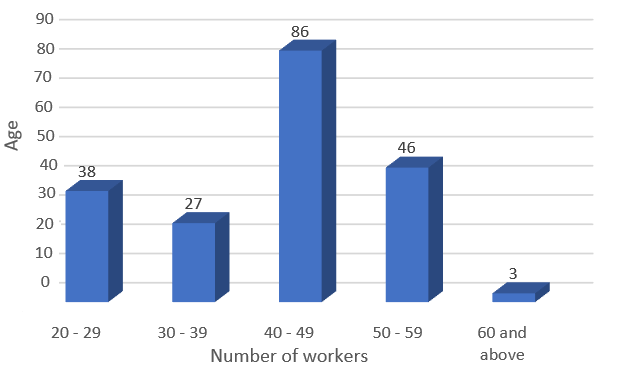

If a person is selected at random, find the probability that the person is.
$i. 40$ years or more:
$a. 0.675$
$b. 0.576$
$c. 0.86$
$d. 0.10$
$ii.$ Under $40$ years:
$a.0$
$b.0.325$
$c.0.531$
$d.0.27$
$iii.$ Having age from $30$ to $39$ years:
$a.0.553$
$b.0.513$
$c.0.135$
$d.0.125$
$iv.$ Under $60$ but above $39$ years:
$a.0.62$
$b.0.66$
$c.0.55$
$d.0.02$
$v.$ Not less than $20$ years:
$a.0$
$b.1.03$
$c.0.01$
$d.1$
A recent survey by a labour organization of the state government of Odisha found that the wages of workers in a factory for different age groups are distributed as given in the bar graph. Read the bar graph carefully and answer the questions that follow.
If a person is selected at random, find the probability that the person is.
$i. 40$ years or more:
$a. 0.675$
$b. 0.576$
$c. 0.86$
$d. 0.10$
$ii.$ Under $40$ years:
$a.0$
$b.0.325$
$c.0.531$
$d.0.27$
$iii.$ Having age from $30$ to $39$ years:
$a.0.553$
$b.0.513$
$c.0.135$
$d.0.125$
$iv.$ Under $60$ but above $39$ years:
$a.0.62$
$b.0.66$
$c.0.55$
$d.0.02$
$v.$ Not less than $20$ years:
$a.0$
$b.1.03$
$c.0.01$
$d.1$