Question
Study the bar graph given below and answer the questions that follow.

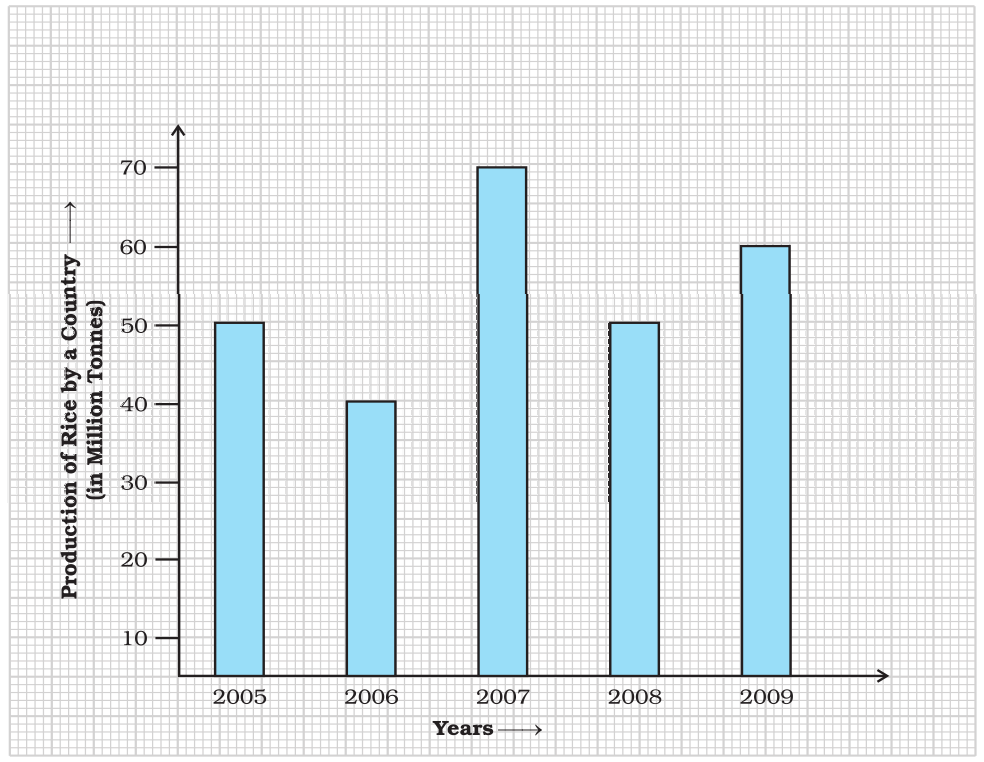
$a.$ What information does the above bar graph represent?
$b.$ In which year was production the least?
$c.$ After which year was the maximum rise in the production?
$d.$ Find the average production of rice during the $5$ years.
$e.$ Find difference of rice production between years $2006$ and $2008.$

Answer

After studying the bar graph, we have
Production of rice in $2005 = 50$ million tonne
Production of rice in $2006 = 40$ million tonne
Production of rice in $2007 = 70$ million tonne
Production of rice in $2008 = 50$ million tonne
Production of rice in $2009 = 60$ million tonne
$a.$ The bar graph shows the production of rice in million tonne by a country during years $2005$ to $2009.$
$b.$ The production of rice was the least in $2006,  i.e. 40$ million tonne.
$c.$ The maximum production of rice was in $2007$. The production rose after $2006.$
$d.$ For average production,
Sum of productions $= 50 + 40 + 70 + 50 + 60 = 270$
Average production $=\frac{\text{Sum of observations}}{\text{Number of observations}}$
Average production $=\frac{270}{5}=54$ million tonne
$e.$ Production in $2006 = 40$ million tonne and production in $2008 = 50$ million tonne
Difference $= 50 - 40 = 10$ million tonne.

Need a full question paper?

Generate a complete, print-ready paper with questions like this in minutes — across 16+ boards, with answer keys.

Start Generating Free

Similar questions

Fill in the following blanks appropriately:
1cm = 10mm1 kg = 1000g1l = 1000ml
1m = 100cm1 g = 1000mg
1km = 1000m

5.5km =_______m35cm =_______ m14.5cm =_______ mm
68g =_______ kg9.02m =_______ mm125.5ml =_______ l
Set up an equation on the basis of the statement given at the end and solve it to find the unknown quantity in the equation so obtained:
Anwar thinks of a number. If he takes away $7$ from $\frac{5}{2}$ of the number, the result is $23$
What should be added to $x y-3 y z+4 z x$ to get $4 x y-3 z x+4 y z+7$ ?
Construct a $\triangle\text{ABC}$ in which $BC = 3.6\ cm, AB = 5\ cm$ and $AC = 5.4\ cm.$ Draw the perpendicular bisector of the side $BC.$
Study the double bar graphs given below and answer the following questions:

$a.$ What information is represented by the above double bar graph?
$b.$ In which month sales of brand $A$ decreased as compared to the previous month?
$c.$ What is the difference in sales of both the brands for the month of June?
$d.$ Find the average sales of brand $B$ for the six months.
$e.$ List all months for which the sales of brand $B$ was less than that of brand.
$f.$ Find the ratio of sales of brand $A$ as compared to brand $B$ for the month of January.
The plan and measurement for a house are given in Fig. The house is surrounded by a path $1m$ wide.
Find the following:
$i.$ Cost of paving the path with bricks at rate of $Rs. 120$ per $m^2.$
$ii.$ Cost of wooden flooring inside the house except the bathroom at the cost of $Rs. 1200$ per $m^2.$
$iii.$ Area of Living Room.
Two parallel lines $l$ and $m$ are cut by a transversal $t.$ If the interior angles of the same side of t be $(2x - 8)o$ and $(3x - 7)o,$ find the measure of each of these angles.
A hall 36 m long and 24 m broad allowing $80 m^2$ for doors and windows, the cost of papering the walls at ₹ $ 8.40$ per $m ^2$ is ₹ $ 9408$. Find the height of the hall.
The performance of a student in $1st$ Term and $2nd$ Term is given. Draw a double bar graph choosing appropriate scale and answer the question:
Subject $1^{st}$ term(M.M.$100)$ $2^{nd}$ term(M.M. $100)$
English $67$ $70$
Hindi $72$ $65$
Maths $88$ $95$
Science $81$ $85$
S. Science $73$ $75$
In which subject, has the child improved his performance the most?