Question
Study the bar graph given below and answer the questions that follow
Image
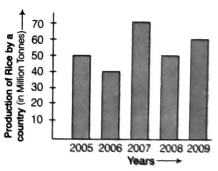
(i) What information does the above bar graph represent?
(Ii) In which year was production the least?
(Iii) After which year was the maximum rise in the production?
(iv) Find the average production of rice during the 5 yr.
(v) Find difference of rice productions between the years 2006 and 2008.

Answer

After studying the bar graph, we have
Production of rice in $2005=50$ million tonne
Production of rice in $2006=40$ million tonne
Production of rice in $2007=70$ million tonne
Production of rice in $2008=50$ million tonne
Production of rice in $2009=60$ million tonne
(i) From above calculation, the bar graph shows the production of rice in million tonne by a country during years 2005 to 2009.
(ii) The production of rice in 2006 was the least 40 million tonne.
(iii) The maximum production of rice was in 2007. The production rose after 2006.
(iv) For average production,
$
\begin{array}{l}
\text { Average }=\frac{\text { Sum of observations }}{\text { Number of observations }} \\
\text { Sum of productions }=50+40+70+50+60 \\
\qquad \begin{aligned}
& =270
\end{aligned} \\
\text { Average }=\frac{270}{5}=54 \text { million tonne }
\end{array}
$
(v) Production in $2006=40$ million tonne
Production in $2008=50$ million tonne
Difference $=50-40=10$ million tonne

Need a full question paper?

Generate a complete, print-ready paper with questions like this in minutes — across 16+ boards, with answer keys.

Start Generating Free