Sample QuestionsData Handling questions
One sample from each question group in this chapter. Select any group above to see the full set with answer keys.
The number of trees in different parks of a city are $33,38,48,33,34,34,33$ and 24 . The mode of this data is
Answer: C.
View full solution →Let $x, y$ and $z$ be three observations. The mean of these observations is
Answer: B.
View full solution →Khilona earned scores of 97, 73 and 88, respectively in her first three examinations. If she scored $8 0$ in the fourth examination, then her average score will be
Answer: D.
View full solution →Which measures of central tendency get affected, if the extreme observations on both the ends of a data arranged in descending order are removed?
Answer: A.
View full solution →The mean of three numbers is 40 . All the three numbers are different natural numbers. If lowest is 19, what could be the heighest possible number of remaining two numbers?
Answer: A.
View full solution →Assertion (A) When a given data is arranged in ascending or descending order, then the middlemost observation is called the median of the data.
Reason (R) Marks scored by seven students in a class are 18, 21, 21, 32, 36, 74, 84. Then, the median is 36.
- A
Both (A) and (R) are true and (R) is the correct explanation of (A)
- B
Both (A) and (R) are true but (R) is not the correct explanation of (A).
- ✓
(A) is true but (R) is false.
- D
(A) is false but (R) is true.
Answer: C.
View full solution →Assertion (A) The mode is always one of the number in a data.
Reason (R) Mode in a data is always greater than mean in data.
- A
Both (A) and (R) are true and (R) is the correct explanation of (A)
- B
Both (A) and (R) are true but (R) is not the correct explanation of (A).
- ✓
(A) is true but (R) is false.
- D
(A) is false but (R) is true.
Answer: C.
View full solution →Assertion (A) The range of the following data 14, 16,
24, 36, 10, 12, 34 is 36-10 =26.
Reason (R) The difference between the highest and the lowest observations in a data is called its range.
- ✓
Both (A) and (R) are true and (R) is the correct explanation of (A)
- B
Both (A) and (R) are true but (R) is not the correct explanation of (A).
- C
(A) is true but (R) is false.
- D
(A) is false but (R) is true.
Answer: A.
View full solution →Assertion (A) Mean =$\frac{14+16+12+18+10}{5}$=$\frac{70}{5}$=14
Reason (R) Mean is the sum of all observations divided by number of observations.
- ✓
Both (A) and (R) are true and (R) is the correct explanation of (A)
- B
Both (A) and (R) are true but (R) is not the correct explanation of (A).
- C
(A) is true but (R) is false.
- D
(A) is false but (R) is true.
Answer: A.
View full solution →The data 6, 4, 3, 8, 9, 12, 13, 9 has mean 9.
The median is always one of the numbers in a data.
The mean is one of the numbers in a data.
The mode is always one of the numbers in a data.
Median of the data may or may not be from the given data.
If the arithmetic mean of $8,4, x, 6,2,7$ is 5 , then the value of $x$ is ____________ .
View full solution →The median of any data lies between the ____________ and ____________ observations.
The mode of the following data $62,61,49,37,91,61$, $47,53,54,97,98,99$ is ____________ .
View full solution →The range of data $17,26,33,37,61,69,91,97$ is ____________ .
View full solution →If 12 observation's mean is 6 . Then, the sum of 12 observations is ____________ .
A car seller collects the following data of cars sold in his shop
| Colour of cars | Number of cars sold |
| Red | 15 |
| Black | 20 |
| White | 17 |
| Silver | 12 |
| Others | 9 |
(i) Which colour of the car is most liked?
(ii) Which measure of central tendency was used in (i)?
The scores in Mathematics test (out of 25) of 15 students is as follows
$
18,21,23,24,19,18,17,16,15,25,22,20,9,4,6 .
$
Find the median of this data.
View full solution →Find the mode of the following weights (in kg ).
$
39,36,35,36,41,49,36
$
View full solution →The scores in Mathematics test (out of 25 ) of 15 students is as follows
$
18,21,23,24,19,18,17,16,15,25,22,20,9,4,6 .
$
Find the median of this data.
View full solution →Find the median of the following data
$
42,46,69,62,91,72,74
$
View full solution →Discuss with your friends and give
two situations where mode would be an appropriate representative value to use.
Discuss with your friends and give
two situations where mean would be an appropriate representative value to use, and
Find atleast 5 numbers between $\frac{1}{2}$ and $\frac{1}{3}$.
View full solution →Consider this data collected from a survey of a colony
Favourite
sport | Cricket | Basket
ball | Swimming | Hockey | Athletics |
| Watching | 1240 | 470 | 510 | 430 | 250 |
| participating | 620 | 320 | 320 | 250 | 105 |
(i) Draw a double bar graph choosing an appropriate scale. What do you infer from the bar graph?
(ii) Which sport is most popular?
(iii) Which is more preferred, watching or participating in sports?
Your friend found the median and the mode of a given data. Describe and correct your friends error if any $35,32,35,42,38,32,34$.
Median $=42$ and Mode $=32$
View full solution →Heights (in cm) of $2 5$ children are given below
$
\begin{array}{l}
168,165,163,160,163,161,162,164,163,162 \text {, } \\
164,163,160,163,160,165,163,162,163,164, \\
163,160,165,163,162 .
\end{array}
$
What is the mode of their heights? What do we understand by mode here?
View full solution →Find the mode of the following data :
$
\begin{array}{l}
12,14,12,16,15,13,14,18,19,12,14,15,16 \text {, } \\
15,16,16,15,17,13,16,16,15,15,13,15,17 \\
15,14,15,13,15,14
\end{array}
$
View full solution →Find the mode of
$2,14,16,12,14,14,16,14,10,14,18,14$.
View full solution →Find the mode of
$2,6,5,3,0,3,4,3,2,4,5,2,4$.
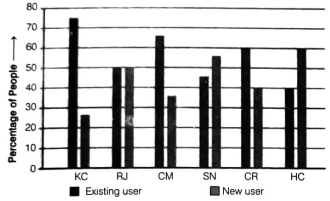
View full solution →View full solution →Gaming apps allow users to download and play games in online or offline mode. A play store data shows 20 million downloads of 6 popular games. The table below shows the number of daily active users of the games
| Game | Active users (in million) |
| KC | 2.07 |
| RJ | 1.99 |
| CM | 1.82 |
| SN | 1.56 |
| CR | 1.34 |
| HC | 1.20 |
(i) Around 50% of those who downloaded the games are active users. Is the statement correct? Give reason to justify your answer.
(ii) Every fourth person who downloaded the games spends more than an hour a day playing them.
What percentage of active players play more than an hour a day?
| Column A | Column B |
| (a) The median of the data 3, 4, 5, 6, 7, 3, 4 is | (i) Bar graph |
| (b) The range of the data 21, 6, 17, 18, 12, 8, 4, 13 is | (ii) 4 |
| (c) The representation of data with bars of uniform width is called | (iii) 17 |
| (d) The mode of the data 3, 4, 5, 6, 7,9, 4 is | (iv) 4 |
| Column A | Column B |
| (a) Arithmetic mean | (i) Highest frequency |
| (b) Range | (ii) Middle observation |
| (c) Median | (iii) $\frac{\text { Sum of all observations }}{\text { Number of observations }}$ |
| (d) Mode | (iv) Highest observation - Lowest observation |
Sale of English and Hindi books in the year 1995, 1996, 1997 and 1998 are given below
| Years | 1995 | 1996 | 1997 | 1998 |
| English | 350 | 400 | 450 | 620 |
| Hindi | 500 | 525 | 600 | 650 |
Draw a double bar graph and answer the following questions:
(i) In which year, was the difference in the sale of the two language books least?
(ii) Can you say that the demand for English books rose faster? Justify.
Find the mean of your sleeping hours during one week.
How would you find the average of your study hours for the whole week?