Question 15 Marks
Your friend found the median and the mode of a given data. Describe and correct your friends error if any $35,32,35,42,38,32,34$.
Median $=42$ and Mode $=32$
AnswerOn arranging the data in ascending order, we get
$
32,32,34,35,35,38,42
$
Now, arrange the data in tabular form.| Numbers | Tally marks | Occurring time (Frequency) |
| 32 | II | 2 |
| 34 | I | 1 |
| 35 | II | 2 |
| 38 | I | 1 |
| 42 | I | 1 |
It is clear from the above table, that 32 and 35 occur two times.
$\therefore$ Mode $=32$ and 35
In the ascending order, the middle value of data is 35 .
$\therefore$ Median $=35$
Hence, the correct mode are 32 and 35 and median is 35. View full question & answer→Question 25 Marks
Heights (in cm) of $2 5$ children are given below
$
\begin{array}{l}
168,165,163,160,163,161,162,164,163,162 \text {, } \\
164,163,160,163,160,165,163,162,163,164, \\
163,160,165,163,162 .
\end{array}
$
What is the mode of their heights? What do we understand by mode here?
AnswerOn rearranging the heights in ascending order, we get
$
\begin{array}{l}
160,160,160,160,161,162,162,162,162,163,163,163 \\
163,163,163,163,163,163,164,164,164,165,165,165 \\
168 .
\end{array}
$Now, we will arrange it in a table form| Numbers | Occurring time (Frequency) |
| 160 | Four times |
| 161 | One time |
| 162 | Four times |
| 163 | Nine times |
| 164 | Three times |
| 165 | Three times |
| 168 | One time |
Here, we observe that 163 is occurring nine times
Le. more frequently.
Hence, the mode of their heights is 163 cm.
By the mode calculated above, we understand that most of
the children have height 163 cm. View full question & answer→Question 35 Marks
Find the mode of the following data :
$
\begin{array}{l}
12,14,12,16,15,13,14,18,19,12,14,15,16 \text {, } \\
15,16,16,15,17,13,16,16,15,15,13,15,17 \\
15,14,15,13,15,14
\end{array}
$
AnswerOn arranging the data in ascending order, we get
$
\begin{array}{l}
12,12,12,13,13,13,13,14,14,14,14,14,15,15,15,15 \\
15,15,15,15,15,15,16,16,16,16,16,16,17,17,18,19
\end{array}
$
Now, we will arrange it in a table form| Numbers | Occurring time (Frequency) |
| 12 | Three times |
| 13 | Four times |
| 14 | Five times |
| 15 | Ten times |
| 16 | Six times |
| 17 | Two times |
| 18 | One time |
| 19 | One time |
It is clear from the table that 15 occurs the maximum
number of times i.e 10.
Hence, mode of the data is 15. View full question & answer→Question 45 Marks
Find the mode of
$2,14,16,12,14,14,16,14,10,14,18,14$.
AnswerWe have, $2,14,16,12,14,14,16,14,10,14,18,14$
On arranging the data in ascending order, we get
$2,10,12,14,14,14,14,14,14,16,16,18$
Now, we will arrange it in a table form:| Numbers | Occurring time (Frequency) |
| 2 | One time |
| 10 | One time |
| 12 | One time |
| 14 | Six times |
| 16 | Two times |
| 18 | One time |
Since, 14 occurs the maximum number of times i.e. 6.
Hence, the mode of the data is 14.
View full question & answer→Question 55 Marks
Find the mode of
$2,6,5,3,0,3,4,3,2,4,5,2,4$.
AnswerWe have, $2,6,5,3,0,3,4,3,2,4,5,2,4$
On arranging the data in ascending order, we get
$
0,2,2,2,3,3,3,4,4,4,5,5,6
$
Now, we will arrange it in a table form| Numbers | Occurring time (Frequency) |
| 0 | One time |
| 2 | Three times |
| 3 | Three times |
| 4 | Three times |
| 5 | Two times |
| 6 | One time |
From the above, it is clear that 2, 3 and 4 occur three times.
Hence 2, 3 and 4 are the mode of the given data.
Alternate Method We also can find the mode of given number by arranging the data in tabular form using tally marks.| Numbers | Tally marks | Occurring time (Frequency) |
| 0 | 1 | 1 |
| 2 | III | 3 |
| 3 | III | 3 |
| 4 | III | 3 |
| 5 | II | 2 |
| 6 | I | 1 |
Since, 2, 3 and 4 occur three times.
Hence, mode =2, 3 and 4
View full question & answer→Question 65 Marks
View full question & answer→Question 75 Marks
Read the bar graph (in the given figure), which shows the number of books sold by a bookstore during five consecutive years and answer the following questions :
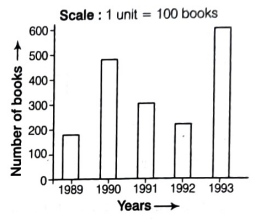
(i) About how many books were sold in 1989, 1990 and 1992?
(ii) In which year were about 475 books sold? About 225 books sold?
(iii) In which years were fewer than 250 books sold?
(iv) Can you explain how you would estimate the number of books sold in 1989?
AnswerFrom the given graph, we have
(i) Number of books sold in $1989=180$ (approx.)
Number of books sold in $1990=475$ (approx.)
Number of books sold in $1992=225$ (approx.)
(ii) About 475 books were sold in the year 1990 and about 225 books were sold in the year 1992.
(iii) In the years 1989 and 1992, fewer than 250 books were sold.
(iv) From the bar graph, it is clear that number of books in the years 1989 is 180 (approx.). We can see in the bar graph that the number of book sold in the year 1989 is little less than 200, but greater than 175 .
View full question & answer→Question 85 Marks
The weights (in kg ) of 15 students of a class are
38,42,35,37,45,50,32,43
43,40,36,38,43,38,47 .
(i) Find the mode and median of this data.
(ii) Is there more than one mode?
AnswerArrange the given data (in kg ) in ascending order, we get
$32,35,36,37,38,38,38,40,42,43,43,43,45,47,50
$
Now, arrange it in tabular form.| Numbers | Tally marks | Occurring time (Frequency) |
| 32 | । | 1 |
| 35 | I | 1 |
| 36 | I | 1 |
| 37 | । | 1 |
| 38 | III | 3 |
| 40 | I | 1 |
| 42 | I | 1 |
| 43 | III | 3 |
| 45 | I | 1 |
| 47 | I | 1 |
| 50 | I | 1 |
Here, 38 and 43 occur more frequently i.e. 3 times.
$\therefore$ Mode $=38$ and $43$
The value of the middle observation is 40 .
$\therefore$ Median $=40$
(ii) Yes, there are two mode i.e. 38 and 43. View full question & answer→Question 95 Marks
The scores in Mathematics test (out of 25) of 15 students is as follows :
$
19,25,23,20,9,20,15,10,5,16,25,20,24,12,20 .
$
Find the mode and median of this data. Are they same?
AnswerOn arranging the data in ascending order, we get
$
5,9,10,12,15,16,19,20,20,20,20,23,24,25,25
$
Now, arrange the data in tabular form.| Numbers | Tally marks | Occurring time (Frequency) |
| 5 | I | 1 |
| 9 | 1 | 1 |
| 10 | 1 | 1 |
| 12 | I | 1 |
| 15 | I | 1 |
| 16 | I | 1 |
| 19 | I | 1 |
| 20 | IIII | 4 |
| 23 | 1 | 1 |
| 24 | I | 1 |
| 25 | II | 2 |
Here, 20 occur more frequently i.e. 4 times.
$
\therefore \quad \text { Mode }=20
$
Since, median is the middle observation and in ascending order middle value is 20 .
$\therefore \quad$ Median $=20$
Yes, both mode and median are the same. View full question & answer→Question 105 Marks
The heights of 10 girls were measured (in cm) and the results are as follows
$
\text { 135, 150, 139, 128, 151, 132, 146, 149, 143, } 141 .
$
(i) What is the height of the tallest girl?
(ii) What is the height of the shortest girl?
(iii) What is the range of the data?
(iv) What is the mean height of the girls?
(v) How many girls have heights more than the mean height?
AnswerOn arranging the data in ascending order, we get
$
128,132,135,139,141,143,146,149,150,151
$
(i) We can observe from the ascending order of heights that last term is maximum. Thus, height of the tallest $girl =151 cm$
(ii) From ascending order of hights, we observe that first term is minimum.
$\therefore$ Height of the shortest girl $=128 cm$
(iii) From ascending order, we get
Highest value $=151$
Lowest value $=128$
$\therefore$ Range of the data $=$ Highest value - Lowest value
$
=151-128=23
$
(iv) Mean height of the girls
$
\begin{array}{l}
=\frac{\text { Sum of the height of all girls }}{\text { Number of girls }} \\
=\frac{128+132+135+139+141+143+146+149+150+151}{10} \\
=\frac{1414}{10}=141.4 cm
\end{array}
$
Hence, the mean height of the girls is 141.4 cm.
(v) It is clear that we have mean height = 141.4 cm
Hence, 5 girls have more height than the mean height
i.e. 143 cm, 146 cm, 149 cm, 150 cm and 151 cm.
View full question & answer→Question 115 Marks
Following table shows the points of each player scored In four games :| Players | Game | Game | Game | Game |
| | 1 | 2 | 3 | 4 |
| A | 14 | 16 | 10 | 10 |
| B | 0 | 8 | 6 | 4 |
| C | 8 | 11 | Did not play | 13 |
Now, answer the following questions :(i) Find the mean to determine A's average number of points scored per game.
(Ii) To find the mean number of points per game for C, would you divide the total points by 3 or by 4?
Why?
(Iii) B played in all the four games. How would you find the mean?
(Iv) Who Is the best performer?
Answer(i) From the given table, we have total sum of points of $A$ in all four games of $A=14+16+10+10=50$
A's average number of points scored per game
$
\begin{array}{l}
=\frac{\text { Sum of points in all the four games }}{\text { Number of games }} \\
=\frac{50}{4}=12.5
\end{array}
$
Hence, the average score of $A$ per game is 12.5 .
(ii) To find the mean number of points per game for $C$, we divide the total points by 3 , because $C$ did not play 3rd game.
(iii) B played in all the four games, therefore his mean is calculated by adding all the points in four games and then dividing by 4 .
$
\begin{aligned}
\therefore \quad \text { Mean } & =\frac{\text { Sum of points in four games }}{\text { Number of games }} \\
& =\frac{0+8+6+4}{4}=\frac{18}{4}=4.5
\end{aligned}
$
Hence, the required mean is 4.5 .
(iv) Average number of points scored by $A=12.5$
[as calculated in part (i)]
Average number of points scored by $B=4.5$
[as calculated in part (iii)]
$
\begin{array}{l}
\text { Average of } C^{\prime} s=\frac{\text { Sum of points in games }}{\text { Number of games }} \\
=\frac{8+11+13}{3}=\frac{32}{3}=10.67 \\
\because 12.5>10.67>4.5
\end{array}
$
Hence, $A$ is the best performer.
View full question & answer→Question 125 Marks
Organise the following marks in a class assessment, in a tabular form
4, 6, 7, 5, 3, 5, 4, 5, 2, 6, 2, 5, 1, 9, 6, 5, 8, 4, 6, 7.
(i) Which number is the highest?
(ii) Which number is the lowest?
(iii) What is the range of the data?
(iv) Find the arithmetic mean.
AnswerThe frequency table is shown below.| Marks | Tally marks | Number of students
(Frequency) |
| 1 | I | 1 |
| 2 | II | 2 |
| 3 | I | 1 |
| 4 | III | 3 |
| 5 |  | 5 |
| 6 | IIII | 4 |
| 7 | II | 2 |
| 8 | I | 1 |
| 9 | I | 1 |
| Total | | 20 |
(i) It is clear from the table that the highest number =9
(ii) It is clear from the table that the lowest number =1
(iii) From the above frequency table,
Highest number = 9
Lowest number =1
$\therefore$Range of data = Highest number - Lowest number
= 9 - 1 = 8
Hence, the range of the data is 8.
(iv) We have, sum of marks
=4+6+7+5+3+5+4+5+2+6+2+5+1+9+6+5+8+4+6+7
=100
Number of students = 20
$
\begin{aligned}
\therefore \text { Arithmetic mean } & =\frac{\text { Sum of marks }}{\text { Number of students }} \\
& =\frac{100}{20}=5
\end{aligned}
$
Hence, the arithmetic mean of the data is 5 .
View full question & answer→Question 135 Marks
Study the bar graph given below and answer the questions that follow
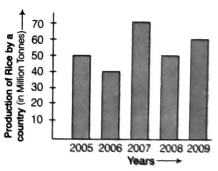
(i) What information does the above bar graph represent?
(Ii) In which year was production the least?
(Iii) After which year was the maximum rise in the production?
(iv) Find the average production of rice during the 5 yr.
(v) Find difference of rice productions between the years 2006 and 2008.
AnswerAfter studying the bar graph, we have
Production of rice in $2005=50$ million tonne
Production of rice in $2006=40$ million tonne
Production of rice in $2007=70$ million tonne
Production of rice in $2008=50$ million tonne
Production of rice in $2009=60$ million tonne
(i) From above calculation, the bar graph shows the production of rice in million tonne by a country during years 2005 to 2009.
(ii) The production of rice in 2006 was the least 40 million tonne.
(iii) The maximum production of rice was in 2007. The production rose after 2006.
(iv) For average production,
$
\begin{array}{l}
\text { Average }=\frac{\text { Sum of observations }}{\text { Number of observations }} \\
\text { Sum of productions }=50+40+70+50+60 \\
\qquad \begin{aligned}
& =270
\end{aligned} \\
\text { Average }=\frac{270}{5}=54 \text { million tonne }
\end{array}
$
(v) Production in $2006=40$ million tonne
Production in $2008=50$ million tonne
Difference $=50-40=10$ million tonne
View full question & answer→Question 145 Marks
Age (in years) of 6 children of two groups are recorded as below.
| Age (in years) |
| Group A | Group B |
| 7 | 7 |
| 7 | 9 |
| 9 | 11 |
| 8 | 12 |
| 10 | 12 |
| 10 | 12 |
(i) Find the mode and range for each group.
(ii) Find the range and mode, if the two groups are combined together
AnswerFrom the given table, age of children in Group
$A=7 yr$, $7 yr , 9 yr , 8 yr , 10 yr , 10 yr$
Age of children in Group $B$
$
=7 yr, 9 yr, 11 yr, 12 yr, 12 yr, 12 yr
$
(i) Mode in Group $A=7 yr$ and 10 yr $\{\because 7 yr$ and $10 yr$ occurs 2 times $\}$
Range in Group $A=$ Maximum value - Minimum value
$=10-7=3$
Mode in Group $B=12 yr$
Range in Group $B=12-7=5$
(ii) If both groups are combined together $7, 7, 7, 9, 9,$
$
\begin{array}{l}
\begin{array}{l}
11,8,12,10,12,10,12 \\
\text { Mode }=7 \text { and } 12 \quad[\because 7 \text { and } 12 \text { occurs } 3 \text { times }] \\
\text { Range }=\text { Maximum value }- \text { Minimum value } \\
=12-7=5
\end{array}
\end{array}
$
View full question & answer→Question 155 Marks
The following are weights (in kg) of 12 people. 70, 62, 54, 57, 62, 84, 75, 59, 62, 65, 78, 60
(i) Find the mean of the weights of the people.
(ii) How many people weight above the mean weight?
(iii) Find the range of the given data.
AnswerThe weights of 12 people are $70,62,54,57,62,84$, $75,59,62,65,78$ and 60.
Sum of weights of 12 people
$\begin{aligned}=70+62+54+57+62+ & 84+75+59+62 \\ & +65+78+60=788\end{aligned}$
$\therefore$ Mean $=\frac{\text { Sum of observations }}{\text { Number of observations }}=\frac{788}{12}=65.66$
(ii) Weights above 65.66 are 70, 84, 75 and 78 i.e. 4 people.
(iii) Range = Maximum value - Minimum valuе
=84-54 = 30
View full question & answer→Question 165 Marks
The mean of 10 observations was calculated as 40. It was detected on rechecking that the value of 45 was wrongly copied as 15. Find the correct mean.
AnswerAs per the given information, mean of 10 observations is 40 .
$
\therefore \text { Mean }=\frac{\text { Sum of all observations }}{\text { Number of observations }}
$
$\Rightarrow
40=\frac{\text { Sum of all observations }}{10}$
Sum of all observations $=40 \times 10=400$
But this is incorrect sum. Since, one observation was copied wrongly.
Correct sum = Incorrect sum - Incorrect observation + Correct observation
$\begin{array}{l}=400-15+45=430 \\ \text { Correct mean }=\frac{\text { Correct sum }}{\text { Number of observations }}=\frac{430}{10}=43\end{array}$
View full question & answer→Question 175 Marks
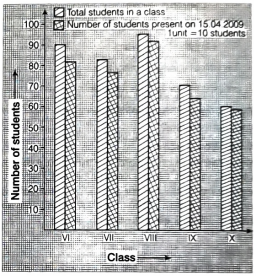
Observe the following data| Government School, Chandpur |
| Daily Attendance | Date: 15.04.2009 |
| Class | Total students | Number of students present on that day |
| VI | 90 | 81 |
| VII | 82 | 76 |
| VIII | 95 | 91 |
| IX | 70 | 65 |
| X | 63 | 62 |
(i) Draw a double bar graph choosing an appropriate scale. What do you infer from the bar graph?
(ii) Which class has the maximum number of students?
(iii) In which class, the difference of total students and number of students present is minimum?
(iv) Find the ratio of number of students present to the total number of students of Class IX.
(v) What per cent of students of Class VI were absent?
Question 185 Marks
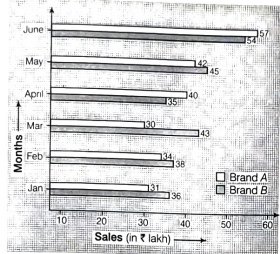
Answer(i) The above double bar graph compares the sale of brands $A$ and $B$ during the months of January to June.
(ii) We can clearly see from the double bar graph that sales for Brand A reduced in the month of March compared to that of February.
(iii) Sales of Brand $A$ in June =₹ 57 lakh and sales of Brand $B$ in June =₹ 54 lakh Difference in sales 57-54=₹ 3 lakh
(iv) Average sales of Brand $B$
$
\begin{array}{l}
\text { Total sales of Brand } B \text { in six months from } \\
=\frac{\text { January to June }}{6}
\end{array}
$
$=\frac{36+38+43+35+45+54}{6}=\frac{251}{6}$= ₹41.83 lakh
(v) We can clearly see from the double bar graph that sales of $\operatorname{Brand} B$ is less than sales of $B r a n d A$ in the month of April and June.
(vi) Sales of Brand $A$ in January $=31$
and sales of Brand $B$ in January $=36$
$\therefore$ Required ratio $=\frac{31}{36}$ or $31: 36$
View full question & answer→Question 195 Marks
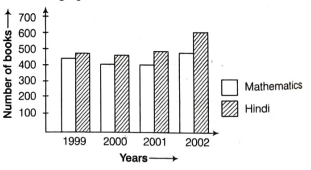
Sale of Mathematics and Hindi books in the years 1999, 2000, 2001 and 2002 are given below.
| Years | 1999 | 2000 | 2001 | 2002 |
| Mathematics | 450 | 400 | 410 | 540 |
| Hindi | 490 | 480 | 540 | 610 |
Draw a double bar graph and answer the following questions
(i) In which year was the difference in the sale of the two subjects books least?
(ii) Can you say that the demand for Mathematics book rose faster?
Question 205 Marks
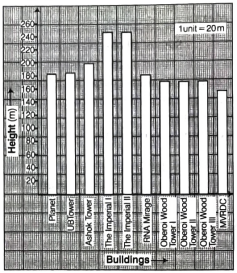
Below is a list of 10 tallest buildings in India. This list ranks buildings in India that stand atleast 150 m (492 ft) tall, based on standard height measurement. This includes spires and architectural details but does not include antenna marks. Following data is given as per the available information till 2009. Since, new buildings are always under construction, go online to check new taller buildings.
Use the information given in the table about skyscrapers to answer the following questions
| Name | City | Height | Floors | Years |
| Planet | Mumbai | 181 m | 51 | 2009 |
| UB Tower | Bengaluru | 184 m | 20 | 2006 |
| Ashok Towers | Mumbai | 193 m | 49 | 2009 |
| The Imperial I | Mumbai | 249 m | 60 | 2009 |
| The Imperial II | Mumbai | 249 m | 60 | 2009 |
| RNA Mirage | Mumbai | 180 m | 40 | 2009 |
| Oberoi Woods Tower I | Mumbai | 170 m | 40 | 2009 |
| Oberoi Woods Tower II | Mumbai | 170 m | 40 | 2009 |
| Oberoi Woods Tower III | Mumbai | 170 m | 40 | 2009 |
| MVRDC | Mumbai | 156 m | 35 | 2002 |
(i) Find the height of each storey of the three tallest buildings and write them in the following table
| Buildings | Height | Number of storeys | Height of each storey |
|
|
|
|
|
|
|
|
|
|
|
|
(ii) The average height of one storey for the buildings given in (i) is ____________ .
(iii) Which city in this list has the largest percentage of skyscrapers? What is the percentage?
(iv) What is the range of data?
(v) Draw a bar graph for given data.
Answer(i) Clearly, Imperial I, Imperial II and Ashok Towers are three tallest buildings.| Buildings | Height | Number
of storeys | Height of each
storey |
| Imperial I | 249 m | 60 | 249/60=4.15 m |
| Imperial II | 249 m | 60 | 249/60=4.15 m |
Ashok
Towers | 193 m | 49 | 193/49=394 m |
(ii) Average height of each storey of the buildings given
in $( i )=\frac{\left[\begin{array}{l}\text { Sum of heights of each storey of three } \\ \text { tallest buildings }\end{array}\right]}{3}$
$=\frac{4.15+4.15+3.94}{3}=\frac{12.24}{3}=4.08 m$
(iii) We can clearly see from the data, Mumbai has maximum number of skyscrapers from the list given. It has 9 skyscrapers out of the list of 10 buildings given.
$
\therefore \quad \text { Required percentage }=\frac{9}{10} \times 100=90 \%
$
(iv) Range of data $=$ Maximum height $-$ Minimum height
$=249-156=93$
(v) A bar graph is shown below:
View full question & answer→Question 215 Marks
Vipin, a Class VII student received cash award of ₹ 5000 in the singing competition. His father advised him to made a budget plan for spending this amount. He made following plan:
| S. No. | Head | Amount |
| 1 | Donation in temple | 150 |
| 2 | Tuition fee to needy child | 200 |
| 3 | Welfare of senior citizens | 300 |
| 4 | Welfare of street children | 300 |
| 5. | Saving in bank | 1500 |
| 6 | Books for family library | 500 |
| 7 | Picnic for family | 650 |
| 8 | Gift to grand parents | 600 |
| 9 | Tea party to friends | 800 |
| | Total | 5000 |
Make a bar graph for the above data,
(i) find the mode and median of above distribution of money.
(ii) which values are depicted in his plan?
AnswerBar graph based on given data,
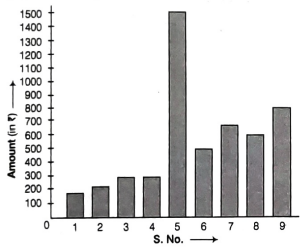
(i) Mode = Heighest frequency observation $=300$
For median, we have to arrange the data in ascending order,
$150,200,300,300,500,600,650,800,1500$ Median $=500$
(ii) Value - He is very socialised student and also very kind towards his socities.
View full question & answer→Question 225 Marks
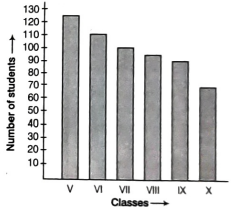
Number of children in six different classes are given below. Represent the data on a bar graph.
| Class | Number of children |
| V | 125 |
| VI | 110 |
| VII | 100 |
| VIII | 95 |
| IX | 90 |
| X | 70 |
(i) Find the average number of children in the classes.
(ii) Find the ratio of students of Class VI to the students of Class VIII.
Question 235 Marks
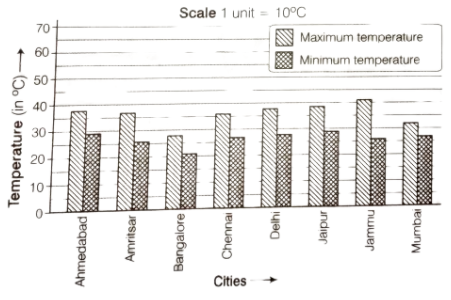
Study the double bar graph given below and answer the questions that follow
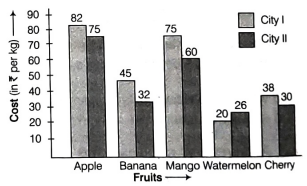
(i) What information does the above double graph depict?
(ii) Name the fruits for which cost of 1 kg is greater in City I as compared to City II.
(iii) What is the difference of rates for apples in both the cities?
(iv) Find the ratio of the cost of mangoes per kg in City! to the cost of mangoes per kg in City II.
AnswerAfter the study of double bar graph,
Cost of apple in City I = 82
Cost of apple in City II =75
Cost of banana in City I =45
Cost of banana in City II = 32
Cost of mango in City I =75
Cost of mango in City II =60
Cost of watermelon in City I = 20
Cost of watermelon in City II =26
Cost of cherry in City I = 38
Cost of cherry in City II = 30
(i) Clearly, the double bar graph compares the cost of different fruits per kg in city I and II.
(ii) Cost of apple in City $I =82$, where in City II is $=75$ Cost of Banana in City $I =45$, where in City $II =32$ Cost of Mango in City I $=75$, where in City $II =60$ Cost of Cherry in City I $=38$, where in City $II =30$ Hence, apple, banana, mango, and cherry prices/costs in City I are greater than City II.
(iii) Difference of rates for apples in cities I and II $=82-75=$₹ $7$ per kg
(iv) The ratio of the cost of mangoes per kg in City I to the cost of mangoes per kg in City $II =75: 60=5: 4$
View full question & answer→Question 245 Marks
Rahul scored of 97, 73 and 80, respectively in his first three examinations. If he scored 70 in the fourth examination, then find how much average score increased/decreased?
AnswerSince, Rahul's scores in three examinations are 97,73 and 80 .
Sum of three scores $=97+73+80=250$
Average of three scores $=\frac{250}{3}=83.33$
If score in fourth examination is 70, then average will be
$
=\frac{250+70}{4}=\frac{320}{4}=80 .
$
Hence, average score decreases by
$
83.33-80=3.33
$
View full question & answer→