Question
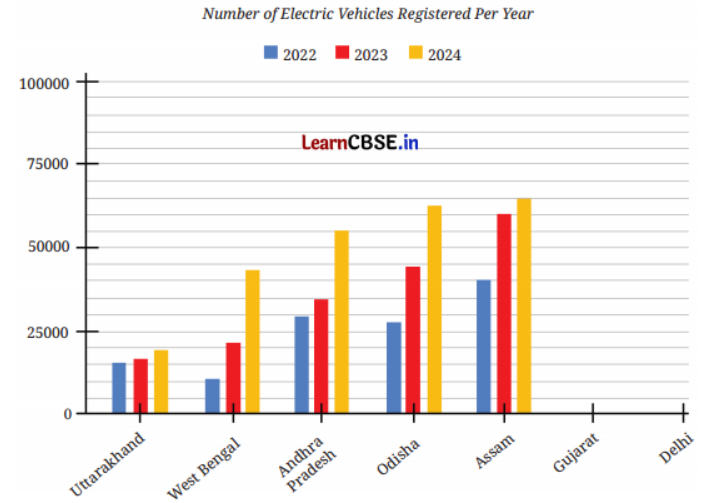
Study the double bar graph given below and answer the questions that follow
Image
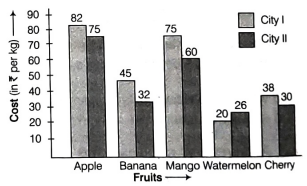
(i) What information does the above double graph depict?
(ii) Name the fruits for which cost of 1 kg is greater in City I as compared to City II.
(iii) What is the difference of rates for apples in both the cities?
(iv) Find the ratio of the cost of mangoes per kg in City! to the cost of mangoes per kg in City II.

Need a full question paper?

Generate a complete, print-ready paper with questions like this in minutes — across 16+ boards, with answer keys.

Start Generating Free

Similar questions

Study the given patterns and complete the table that follows :
Image
Image
Image
Simplify: $\Big(\frac{3}{11}\times\frac{5}{6}\Big)-\Big(\frac{9}{12}\times\frac{4}{3}\Big)+\Big(\frac{5}{13}\times\frac{6}{15}\Big)$
The following data gives the amount of manure $($in thousand tonnes$)$ manufactured by a company during some years:
Year $1992$ $1993$ $1994$ $1995$ $1996$ $1997$
Manure $($in thousand tonnes$)$ $15$ $35$ $45$ $30$ $40$ $20$
Represent the above data with the help of a bar graph.
$1.$ Indicate with the help of the bar graph the year in which the amount of manure manufactured by the company was maximum.
$2.$ Choose the correct alternative:
The consecutive years during which there was maximum decrease in manure production are:
Find the products given below and case verify the result for $a = 1, b = 2$ and $c = 3$. $\Big(\frac{2}{5}\text{a}^2\text{b}\Big)\times (-15\text{b}^2\text{ac})\times\Big(-\frac{1}{2}\text{c}^2\Big)$
An exterior angle of a triangle measures $110^\circ $ and its interior opposite angles are in the ratio $2 : 3$. Find the angles of the triangle.
What must be added to $12 x^3-4 x^2+3 x-7$ to make the sum $x^3+2 x^2-3 x+2$ ?
The following clustered-bar graph shows the number of electric vehicles registered in some states every year from 2022 to 2024.

Image

(a) The data (rounded off to thousands) for the states of Gujarat and Delhi are given in the table below.
Mark the corresponding bars on the bar graph. (It is enough if you place the top of the bars between the two appropriate vertical guidelines.)
202220232024
Gujarat690008900078000
Delhi620007400081000
(b) Notice how the graph is organised, what scale is used, and what patterns the data shows.
(c) How would you describe the change for various states between 2022 and 2024?
(d) Approximately how many more registrations did Assam get in 2023 compared to 2022?
(e) How many times more did the registrations in West Bengal increase from 2022 to 2024?
(f) Is this statement correct—‘There were very few new registrations in Uttarakhand in 2023 and 2024, as the increase in the bar lengths is minimal’?
In Fig.$A B \| C D$ and $A E \| C F ; \angle F C G=90^{\circ}$ and $\angle B A C=120^{\circ}$. Find the values of $x, y$ and $z$.
Image
The following data shows the average age of men in various countries in a certain year:
CountryIndiaNepalChinaPakistanU.K.U.S.A.
Average age (in years)555260507075
Represent the above information by a bar graph.
The students of class $VII$ have to choose one club from Music, Dance, Yoga, Dramatics, Fine arts and Electronics clubs. The data given below shows the choices made by girls and boys of the class. Study the table and answer the questions that follow:
Clubs
Music
Dance
Yoga
Dramatics
Fine Arts
Electronics
Girls
$15$
$24$
$10$
$19$
$27$
$21$
Boys
$12$
$16$
$8$
$17$
$11$
$30$
$a.$ Draw a double bar graph using appropriate scale to depict the above data.
$b.$ How many students are there in Class $VII?$
$c.$ Which is the most preferred club by boys?
$d.$ Which is the least preferred club by girls?
$e.$ For which club the difference between boys and girls is the least?
$f.$ For which club is the difference between boys and girls the maximum?