The displacement of a particle varies according to the relation $x = 4(cos\pi t + sin\pi t).$ The amplitude of the particle is
AIEEE 2003, Easy
Download our app for free and get started
(d) For given relation
Resultant amplitude $ = \sqrt {{4^2} + {4^2}} = 4\sqrt 2 $
Resultant amplitude $ = \sqrt {{4^2} + {4^2}} = 4\sqrt 2 $

Download our appand get started for free
Experience the future of education. Simply download our apps or reach out to us for more information. Let's shape the future of learning together!No signup needed.*
Similar Questions
- 1A particle executes simple harmonic motion with a frequency $f$. The frequency with which its kinetic energy oscillates isView Solution
- 2If the length of second's pendulum is decreased by $2\%$, how many seconds it will lose per day ...... $\sec$View Solution
- 3View SolutionA simple pendulum is vibrating in an evacuated chamber, it will oscillate with
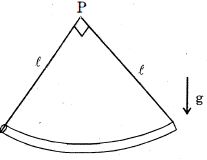
- 4A circular arc of mass $m$ is connected with the help of two massless strings as shown in the figuw in vertical plane. About point $P$, small oscillations are given in the plane of the arc. Time period of the oscillations of $SHM$ will beView Solution
- 5The phase of a particle executing simple harmonic motion is $\frac{\pi }{2}$ when it hasView Solution
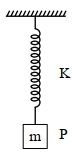
- 6In simple harmonic motion, the total mechanical energy of given system is E. If mass of oscillating particle $P$ is doubled then the new energy of the system for same amplitude is:View Solution
- 7The amplitude and the periodic time of a $S.H.M.$ are $ 5\,cm$ and $6\,sec$ respectively. At a distance of $2.5\,cm$ away from the mean position, the phase will beView Solution
- 8A simple harmonic oscillator of angular frequency $2\,rad\,s^{-1}$ is acted upon by an external force $F = sin\,t\,N .$ If the oscillator is at rest in its equilibrium position at $t = 0,$ its position at later times is proportional toView Solution
- 9A mass $0.9\,kg$, attached to a horizontal spring, executes $SHM$ with an amplitude $A _{1}$. When this mass passes through its mean position, then a smaller mass of $124\,g$ is placed over it and both masses move together with amplitude $A _{2}$. If the ratio $\frac{ A _{1}}{ A _{2}}$ is $\frac{\alpha}{\alpha-1}$, then the value of $\alpha$ will be$......$View Solution
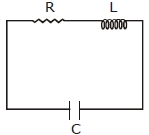
- 10An $LCR$ circuit is equivalent to a damped pendulum. In an $LCR$ circuit the capacitor is charged to $Q_0$ and then connected to the $L$ and $R$ as shown below.View Solution
If a student plots graphs of the square of maximum charge $( Q_{Max} ^2 )$ on the capacitor with time$(t)$ for two different values $L_1$ and $L_2 (L_1 > L_2)$ of $L$ then which of the following represents this graph correctly? (plots are schematic and not drawn to scale)