MCQ
The graph. Shown in the adjacent diagram, represents the variation of temperature $(T)$ of two bodies, $x$ and $y$ having same surface area, with time $(t)$ due to the emission of radiation. Find the correct relation between the emissivity
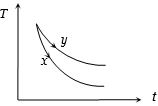
  • A
    ${e_x} > {e_y}$ and ${a_x} < {a_y}$
  • B
    ${e_x} > {e_y}$ and ${a_x} < {a_y}$
  • ${e_x} < {e_y}$ and ${a_x} > {a_y}$
  • D
    ${e_x} > {e_y}$ and ${a_x} > {a_y}$

Answer

Correct option: C.
${e_x} < {e_y}$ and ${a_x} > {a_y}$
c
(c) Rate of cooling $\left( { - \frac{{dT}}{{dt}}} \right)\; \propto $ emissivity $(e)$
From graph, ${\left( { - \frac{{dT}}{{dt}}} \right)_x} > {\left( { - \frac{{dT}}{{dt}}} \right)_y}$

==> ${e_x} > {e_y}$
Further emissivity $(e)$ $\propto$ Absorptive power $(a)$

==> ${a_x} > {a_y}$
( good absorbers are good emitters).

Need a full question paper?

Generate a complete, print-ready paper with questions like this in minutes — across 16+ boards, with answer keys.

Start Generating Free