MCQ
The graphs in figure show that a quantity $y$ varies with displacement $d$ in a system undergoing simple harmonic motion. Which graphs best represents the relationship obtained when $y$ is The time
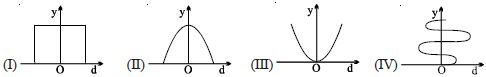
- A$I$
- B$II$
- C$III$
- ✓$IV$
Generate a complete, print-ready paper with questions like this in minutes — across 16+ boards, with answer keys.
$(A)$ The masses remains at rest
$(B)$ The $3\,kg$ mass moves uniformly while $2\, kg$ mass moves with acceleration $\frac{2}{5}\, g \,m/s^2$
$(C)$ Both bodies move with acceleration $\frac{2}{5} \,g \,m/s^2$
$(D)$ The tension in the string near the first body is more than that near the second body
$(E)$ The tension in the string is $\frac{6g}{5}\, N $
Then the correct statements are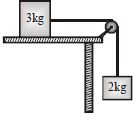
where $X = \frac{{{A^2}{B^{\frac{1}{2}}}}}{{{C^{\frac{1}{3}}}{D^3}}}$, will be