Question
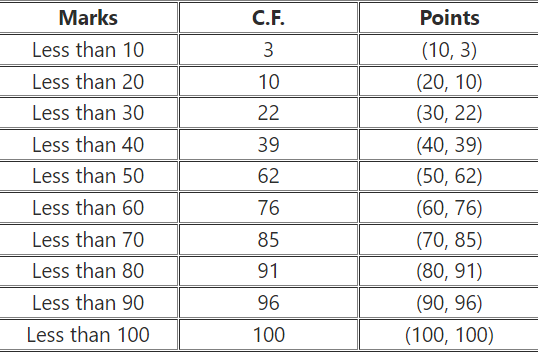
The marks obtained by $100$ students in a Mathematics test are given below:
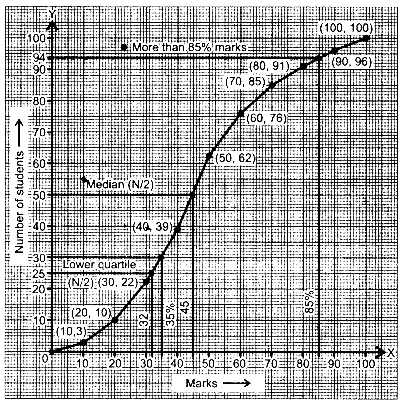
Draw an ogive for the given distribution on a graph sheet.
(Use a scale of $2 cm = 10$ units on both axis).
use the ogive to estimate the :
(i) median.
(ii) lower quartile.
(iii) number of students who obtained more than 85% marks in the test.
(iv) number of students who did not pass in the test if the pass percentage was $35.$
| Marks | $0 - 10$ | $10 - 20$ | $20 - 30$ | $30 - 40$ | $40 - 50$ | $50 - 60$ | $60 - 70$ | $70 - 80$ | $80 - 90$ | $90 - 100$ |
| No. of Students | $3$ | $7$ | $12$ | $17$ | $23$ | $14$ | $9$ | $6$ | $5$ | $4$ |
(Use a scale of $2 cm = 10$ units on both axis).
use the ogive to estimate the :
(i) median.
(ii) lower quartile.
(iii) number of students who obtained more than 85% marks in the test.
(iv) number of students who did not pass in the test if the pass percentage was $35.$