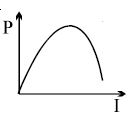
The variation of current $(I)$ and voltage $(V)$ is as shown in figure $A$. The variation of power $P$ with current $I$ is best shown by which of the following graph
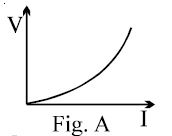
- A
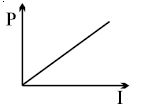
- B
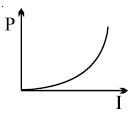
- C
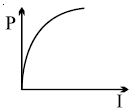
- D
Medium


Download our appand get started for free
Experience the future of education. Simply download our apps or reach out to us for more information. Let's shape the future of learning together!No signup needed.*
Similar Questions
- 1With the help of potentiometer, we can determine the value of emf of a given cell. The sensitivity of the potentiometer isView Solution
$(A)$ directly proportional to the length of the potentiometer wire
$(B)$ directly proportional to the potential gradient of the wire
$(C)$ inversely proportional to the potential gradient of the wire
$(D)$ inversely proportional to the length of the potentiometer wire
Choose the correct option for the above statements:
- 2View SolutionThe drift velocity does not depend upon
- 3View SolutionWhich of the following is not a correct statement
- 4View SolutionIn the following diagram the wheat stone bridge is balanced when we interchange the resistances of
- 5A cylindrical wire of radius $0.5 \,mm$ and conductivity $5 \times 10^{7}\, S / m$ is subjected to an electric field of $10 \,mV / m .$ The expected value of current in the wire will be $x ^{3} \,\pi mA$. The value of $x$ is ......View Solution
- 6View SolutionSee the electrical circuit shown in the adjoining figure. Which of the following equation is a correct equation for it
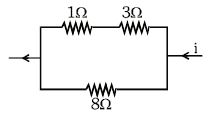
- 7Power dissipated across the $8\,\Omega $ resistor in the circuit shown here is $2\, watt$. The power dissipated in watt units across the $3\,\Omega $ resistor isView Solution
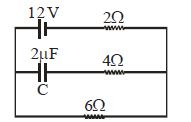
- 8Find the maximum charge on the capacitor $C$ in the following circuit ............ $\mu C$View Solution
- 9What is net force on the small dipole placed inside the capacitor at steady state if the plates are separated by $1\ cm$ ?......$N$View Solution
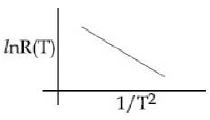
- 10View SolutionIn an experiment, the resistance of a material is plotted as a function of temperature (in some range). As shown in the figure, it is a straight line. One may conclude that: